When I want add checkmk to grafana it shows follow error ![]()
1- What should I do ?
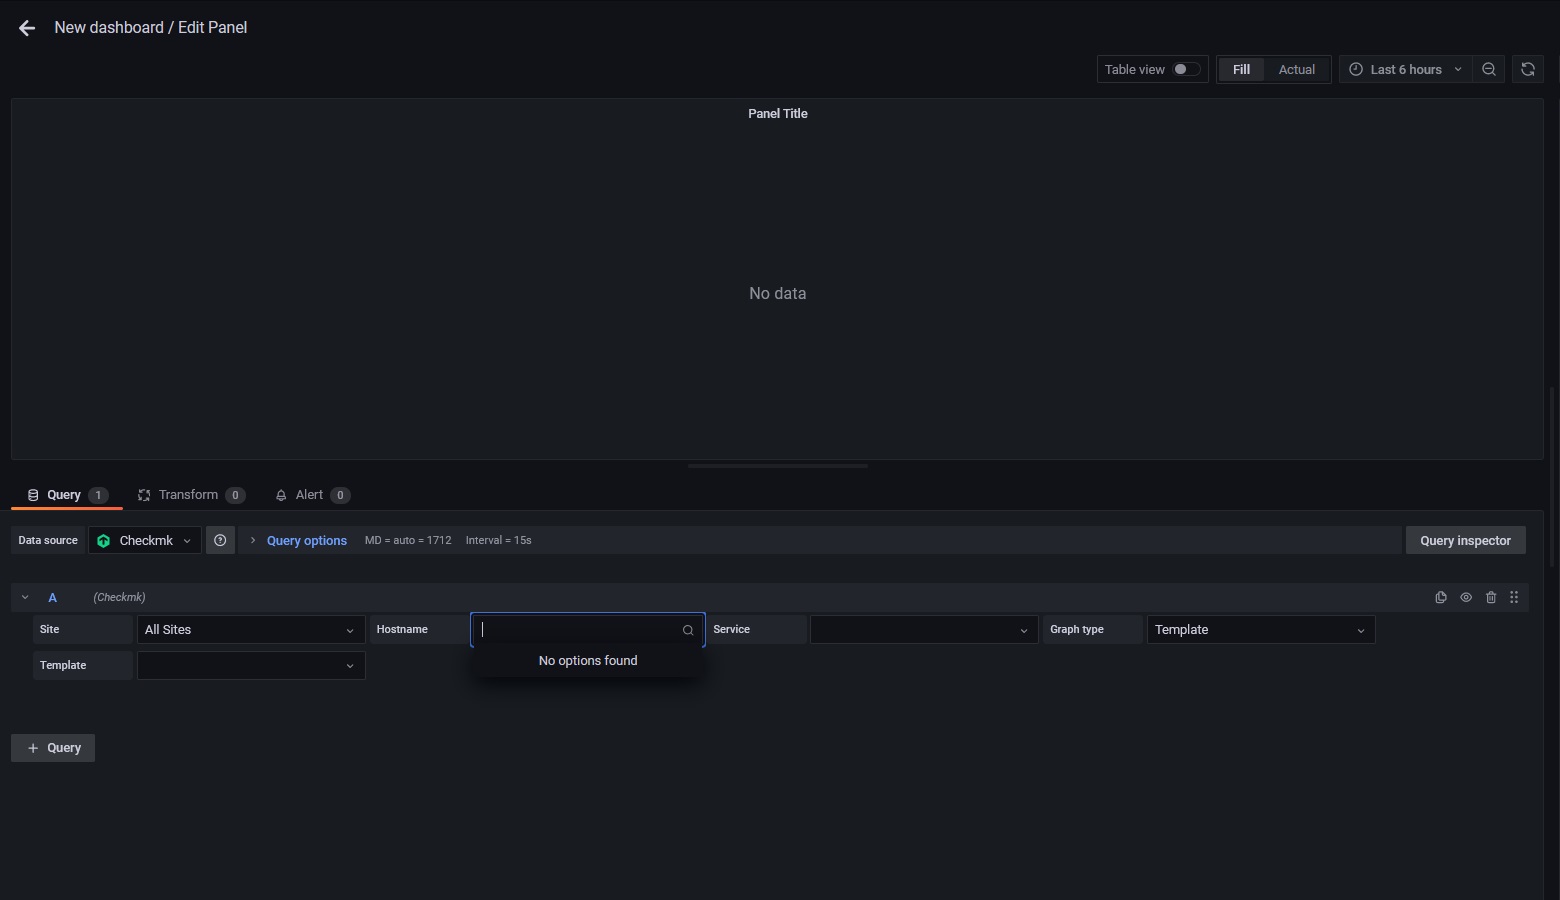
2- I have added 1 ESXi host to checkmk. Now when I want to create a dashboard after select checkmk as source just can choose site and there are not any option as hostname , services , …
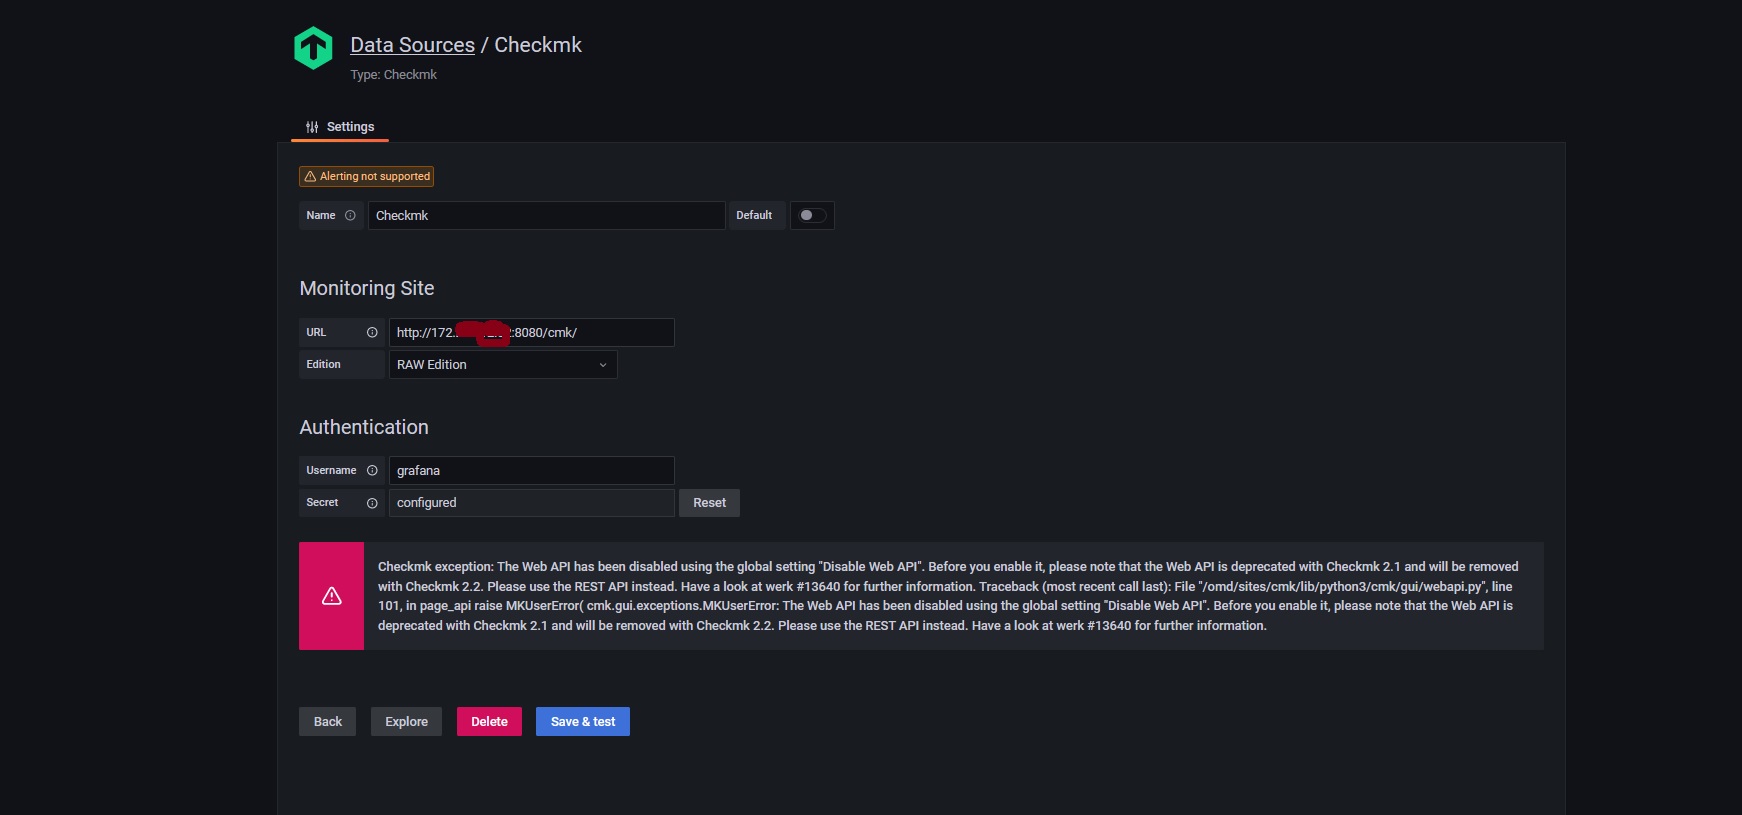
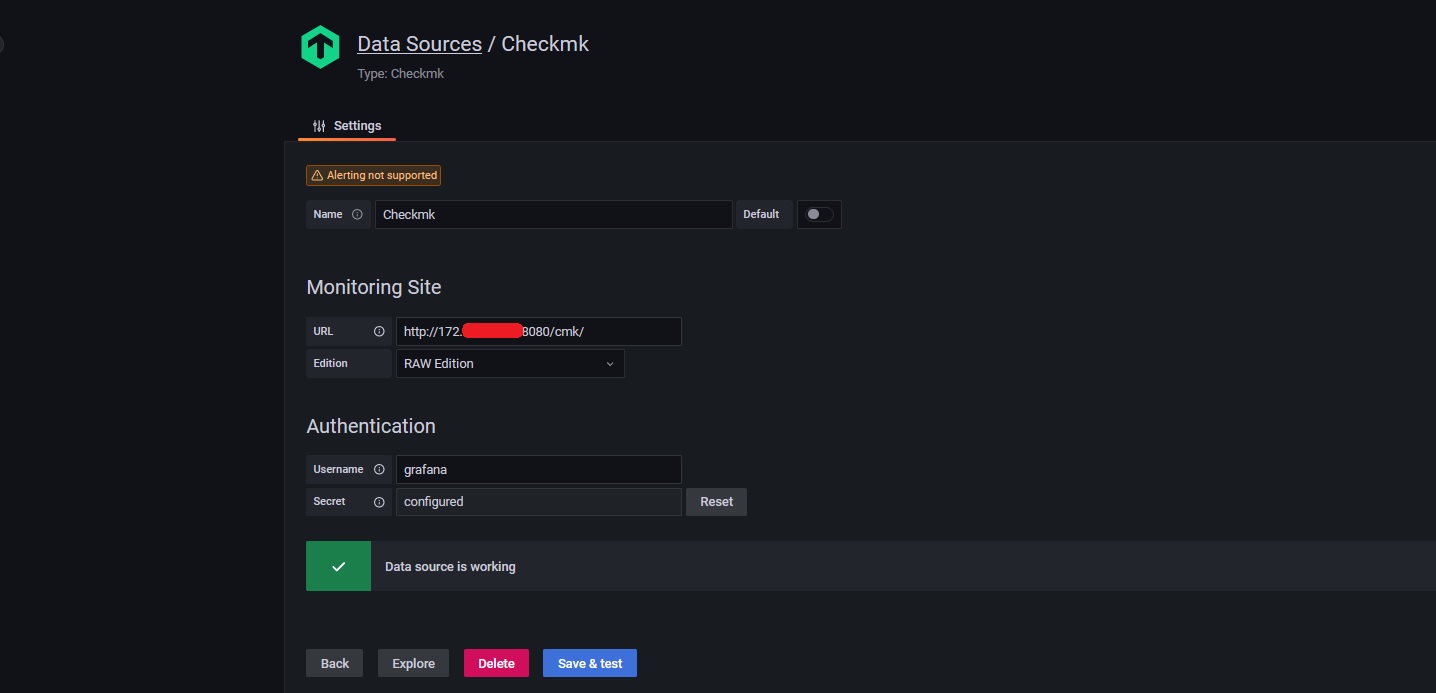
You need to fix first the error message on the bottom. That’s the reason for not seeing anything.
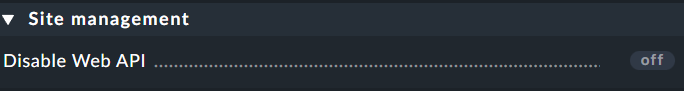
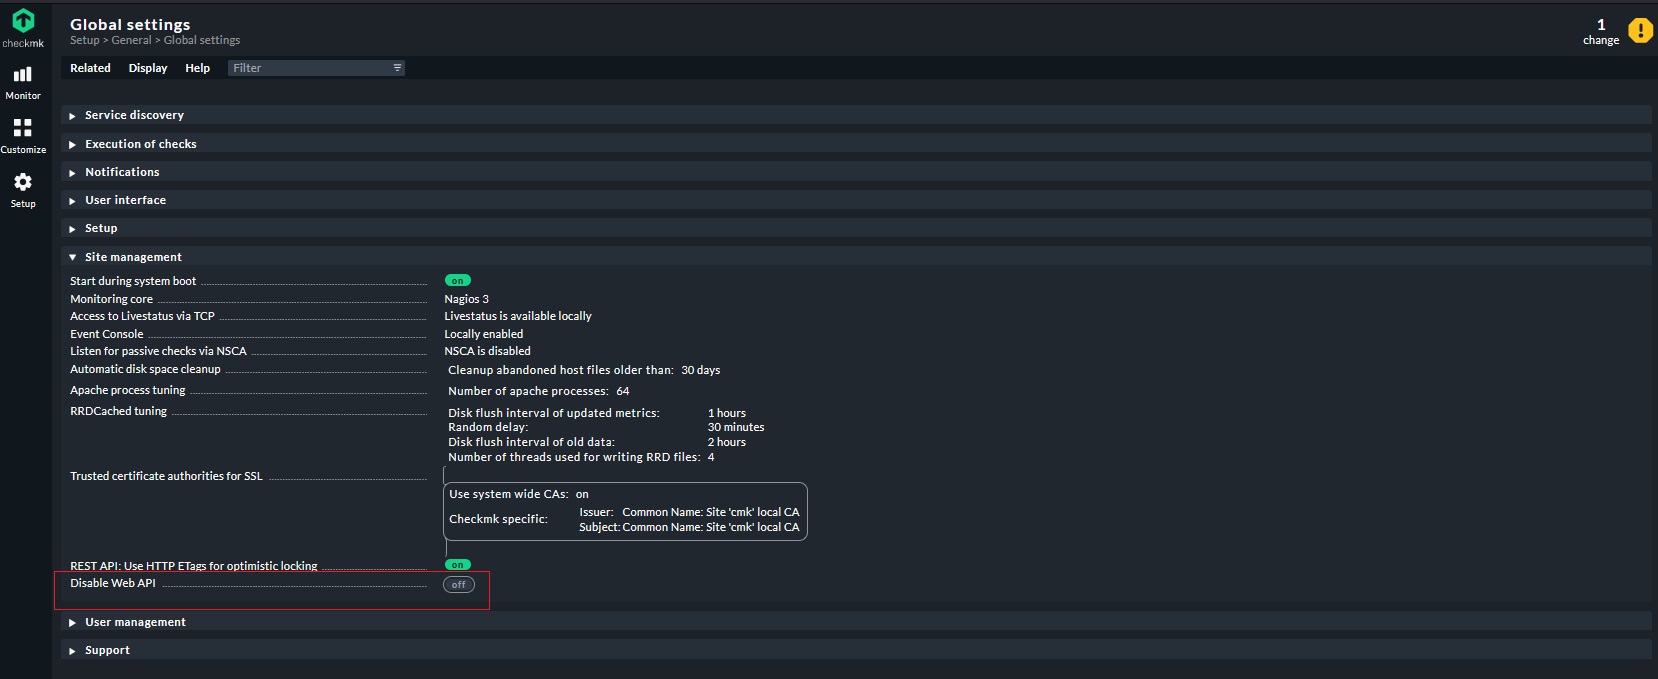
So thanks. According to attached pic I changed Disable Web API = Off
and another save/test in grafana datasource that is OK but another in grafana just show sites and cannot get data
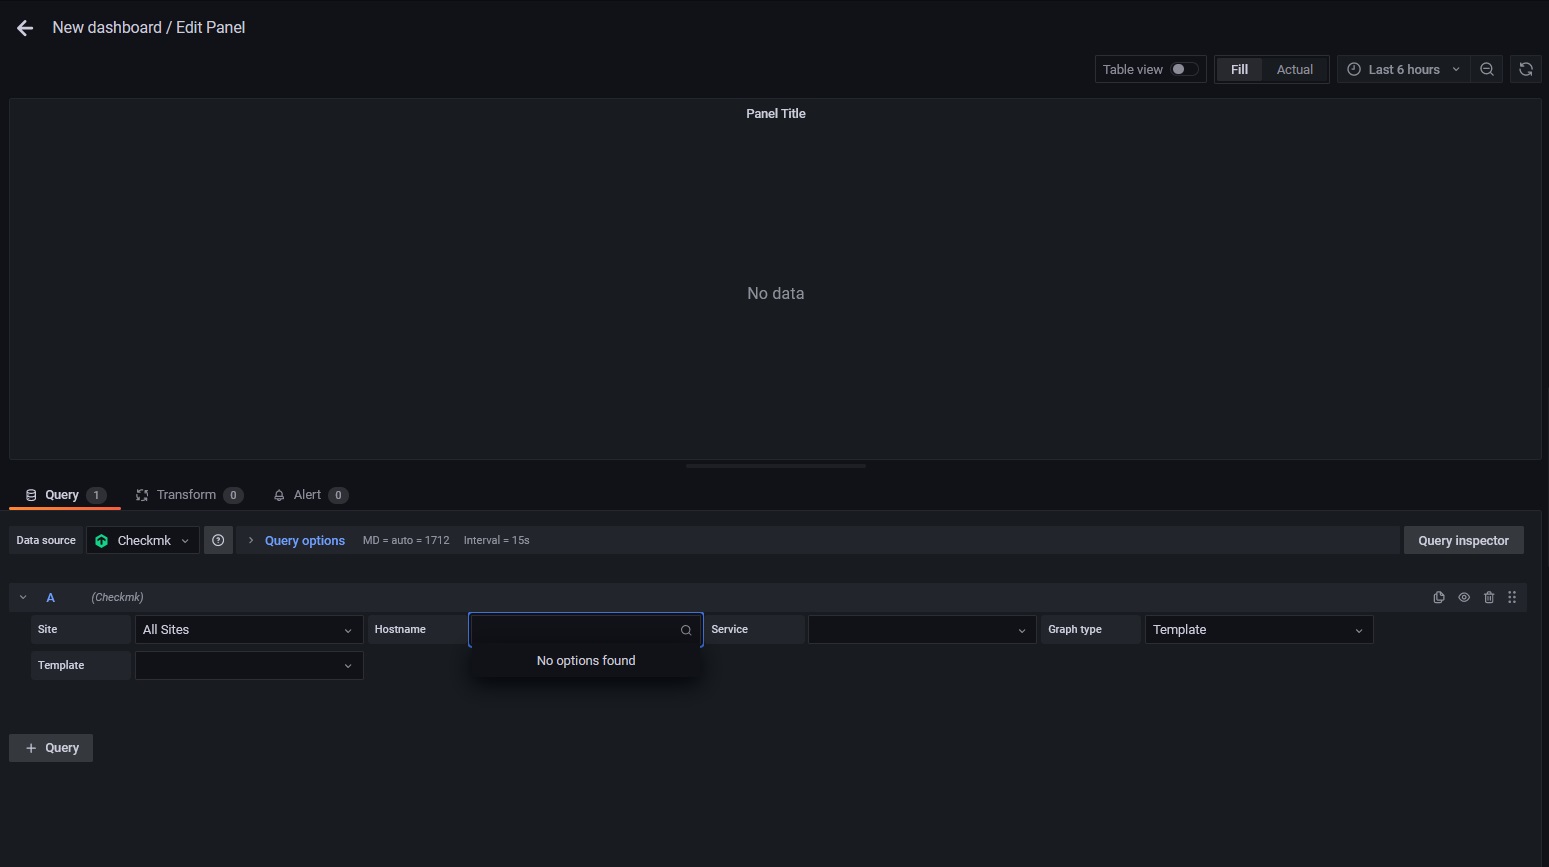
Would you please help me what is the solution ? why cannot see any metric or service in grafanan?
We will need more context here:
- what checkmk version do you use?
- are there suspicious entries in
var/log/apache/access_logof your site? - are there suspicious entries in the grafana log?
- are there any errors in the development console of your browser?
For debugging purpose it would also be a good idea to use the automation user, so we can rule out any permission problems, as this user has admin permissions.
The issue solved . it relates to user permission that defined in checkmk to add in grafana
This topic was automatically closed 365 days after the last reply. New replies are no longer allowed. Contact an admin if you think this should be re-opened.