Today when scraping Prometheus with custom PromQL metrics is automatically exported to defined InfluxDB connectors.
This is super useful as additional host and service labels created in Checkmk are added to the metrics created in InfluxDB and can be used to enrich data (for example if an integration with a CMDB exists in Checkmk)
Will the new metrics backend support the same if Clickhouse metrics are attached to hosts and services?
We already have a draft of the new OpenTelemetry article. Sorry, German only for a few more days. OpenTelemetry-Metriken überwachen Maybe use DeepL for a coarse translation.
Yes. And no, not necessarily…
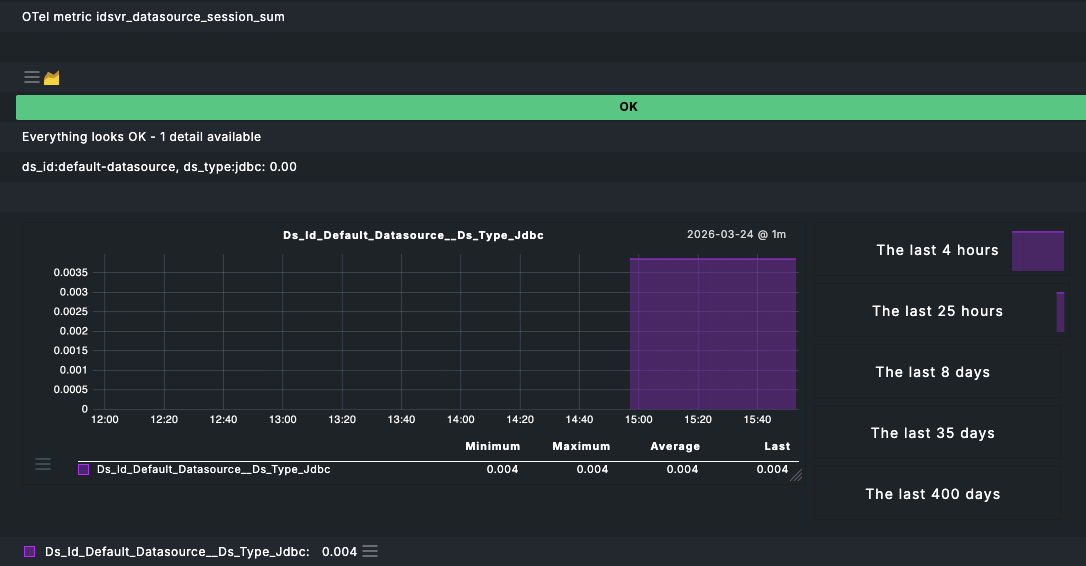
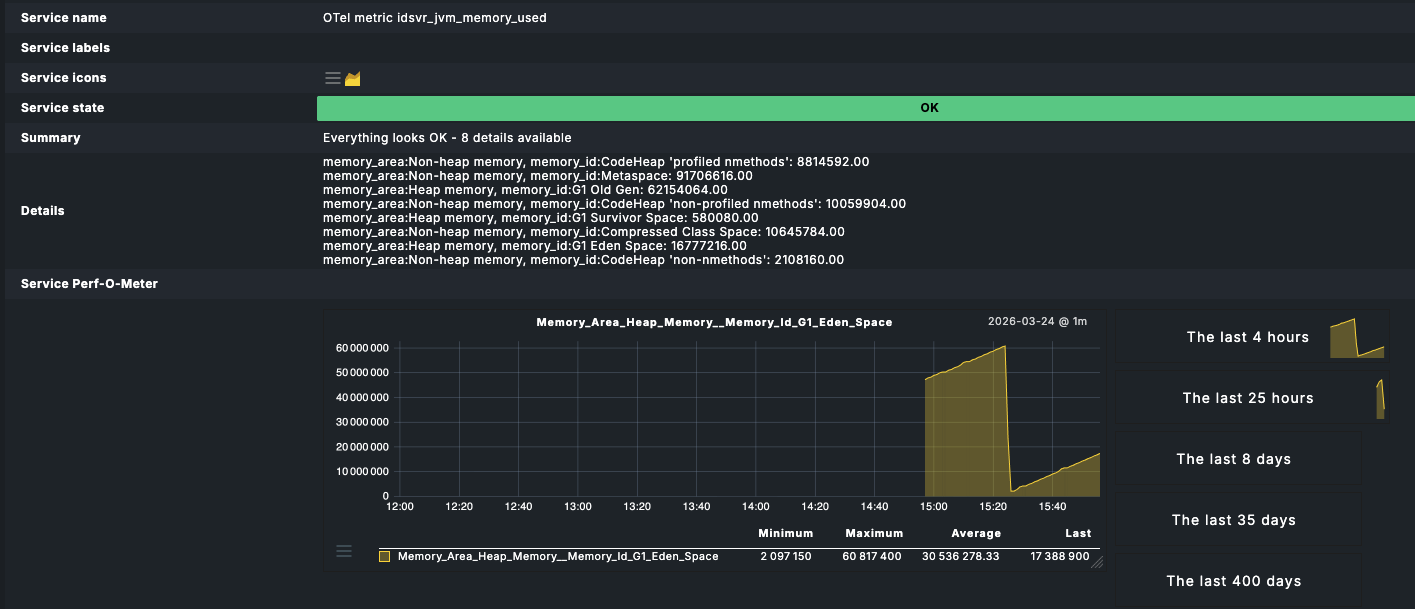
OTel metrics are directly fed to Clickhouse. You can use those to create custom graphs which are then also directly generated without involving the core. However, there is also the possibility to configure a special agent to attach metrics from Clickhouse to arbitrary hosts. And there is the possibility to create CMK hosts from metrics stored in Clickhouse via DCD. Typically, one OTel service name generates the CMK host name and one OTel metric name one CMK service. This is then fed to the core using a specialized fetcher.
Yes, my german is a bit rusty, and did find it as it was mentioned on the English page that the German one is more updated..
I was still not very easy, especially for the DCD. I have used DCD to create hosts when using the OTel (gRPC) and it has somewhat worked (I was hoping the metrics names would have keep the otel format as this is standardized) when exporting it to influxdb but that was not the case)
Now I’m working on the prometheus compatible /metrics scraping as that have been a use case we have not been able to support in 2.4.
My biggest problem was that I was not able to get Metric backend (Custom query) to work - but the problem was that the host was configured as “No API Integration/No Agent” as i was thinking services would have been added just like active checks..
Scraping metrics might not be ideal for me, but will continue to explore
There is currently a bug in Custom Query, you have to set the generated CMK service name using macros and freeform text. But you can leave it empty and when it’s empty, no visible service is generated. Will be fixed.
I also assume that the OpenTelemetry article will get the first translation treatment next week.
there are currently two ways how Checkmk interacts with the new metric backend:
Custom graphs which query it directly
Metric backend fetchers (this is an option in the host properties the DCD sets) which also query it directly. This creates Checkmk services and can be used to export data for your use case. But it might have a performance penalty (see below for future solution)
What we are building next is a ‘query engine’ which sits between Checkmk and the metric backend to allows manipulation of the data (e.g. avg by attribute). Eventually the query engine will sit as a intermediate layer between Checkmk and any metric backend (be it Clickhouse or RRDs) for abstraction. I can imagine that query engine becomes then also something like Livestatus 2.0 to supply any metric type + host/service labels so that you can export them efficiently.
For exporting the data, it might actually make more sense to just query Clickhouse (the metric backend) directly for now (and in the future via the query engine).
It would be helpful, if one of our PMs (@Niklas) could talk to you directly to understand your needs better as we are currently designing all the features for Checkmk 3.0 and now is your time to influence that. If interested, send me or Niklas a PM with your email.