On the Check_MK server in /omd/sites/SITENAME/lib/python3/cmk/base/plugins/agent_based/win_dhcp_pools.py I found the following:
# Example outputs from agent:
#
# <<<win_dhcp_pools>>>
#
# MIB-Anzahl:
# Entdeckungen = 0.
# Angebote = 0.
# Anforderungen = 0.
# Acks = 0.
# Naks = 0.
# Abweisungen = 0.
# Freigaben = 0.
# ServerStartTime = Dienstag, 29. Juni 2010 19:08:55
# Bereiche = 1.
# Subnetz = 192.168.123.0.
# Anzahl der verwendeten Adressen = 0.
# Anzahl der freien Adressen = 239.
# Anzahl der anstehenden Angebote = 0.
#
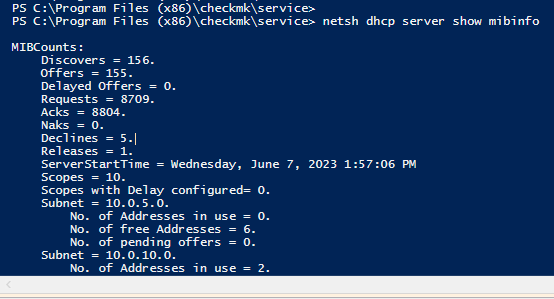
# MIBCounts:
# Discovers = 0.
# Offers = 0.
# Requests = 0.
# Acks = 1.
# Naks = 0.
# Declines = 0.
# Releases = 0.
# ServerStartTime = Sunday, May 25, 2008 12:38:06 PM
# Scopes = 1.
# Subnet = 172.16.11.0.
# No. of Addresses in use = 1.
# No. of free Addresses = 23.
# No. of pending offers = 0.
In the expected example output, the two lines are missing:
Verzgerte Angebote = 0.
Bereiche mit konfigurierter Verzgerung= 0
Is it possible that this is why this plugin no longer works? The two additional lines in the output on a Windows server 2022? Unfortunately, I don’t have a Windows DHCP server < 2022 to check the output there.
Then you can find the following in the Python script:
# Attention:
#
# Tried to get the win-agent plugin to report always in utf-8, unfortunately without luck.
# ...that's the reason why french translations with special characters must get provided like here.
As a first step, I’ll try to get the CMD output in UTF-8. Let’s see how this is supposed to work?!
If that doesn’t help, I’ll try to filter out the two lines.
.
.
.
If the CheckMK server receives the agent output in UTF-8, the check still does not work. 
I added the following line to win_dhcp_pools.bat after the “@echo off” line:
chcp 65001>nul
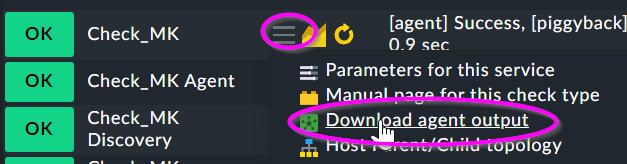
Now the downloaded agentoutput looks good belong the umlaut.
<<<win_dhcp_pools>>>

MIB-Anzahl:
	Entdeckungen = 266707.
	Angebote = 248047.
	Verzögerte Angebote = 0.
	Anforderungen = 237775.
	Acks = 248740.
	Naks = 237.
	Abweisungen = 4.
	Freigaben = 48225.
	ServerStartTime = Mittwoch, 17. April 2024 13:16:23
	Bereiche = 58.
	Bereiche mit konfigurierter Verzögerung= 0
Greetings to the developer… maybe this will help with the French translation. 
Windows DHCP on 2022 in german will need this too, if this Verzögerung values will be monitored in future.
Unfortunately, filtering out the two lines was unsuccessful.
To do this, I expanded the line with the netsh call at the end:
| find /V "Verzögerte Angebote" | find /V "Bereiche mit konfigurierter Verzögerung"
The agent output looks good:
MIB-Anzahl:
	Entdeckungen = 267284.
	Angebote = 248542.
	Anforderungen = 238357.
	Acks = 249342.
	Naks = 237.
	Abweisungen = 4.
	Freigaben = 48417.
	ServerStartTime = Mittwoch, 17. April 2024 13:16:23
	Bereiche = 58.
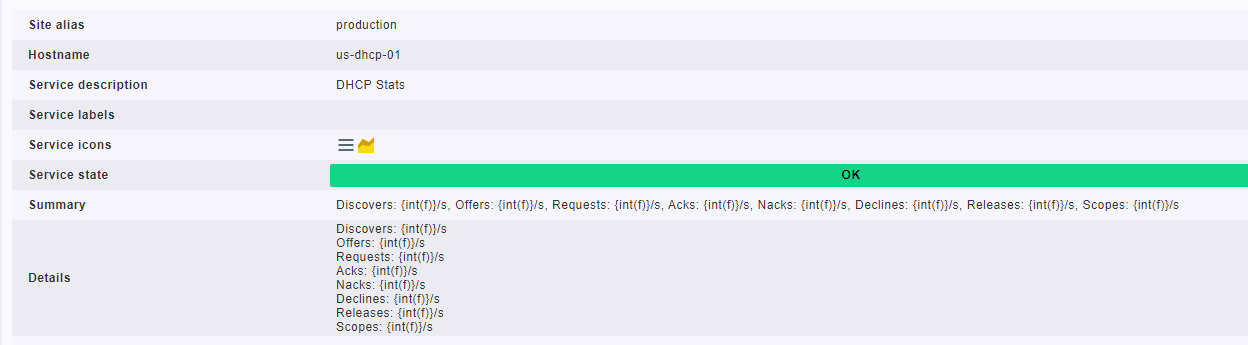
But the check still shows garbage
Discovers: {int(f)}/s, Offers: {int(f)}/s, Requests: {int(f)}/s, Acks: {int(f)}/s, Nacks: {int(f)}/s, Declines: {int(f)}/s, Releases: {int(f)}/s, Scopes: {int(f)}/s
I suspect the error in the plugin on the server.
Maybe here? Because the plugin outputs the lambda expression.
def check_win_dhcp_pools_stats(section: Section) -> CheckResult:
    this_time = time.time()
    value_store = get_value_store()

    for line in section:
        if len(line) > 0:
            key = _WIN_DHCP_POOLS_STATS_TRANSLATE.get(line[0], line[0])
            if key in [
                "Discovers",
                "Offers",
                "Requests",
                "Acks",
                "Nacks",
                "Declines",
                "Releases",
                "Scopes",
            ]:
                value = _safe_int(line[1])
                yield from check_levels(
                    get_rate(value_store, key, this_time, value),
                    metric_name=key,
                    render_func=lambda f: "{int(f)}/s",
                    label=key,
                )