CMK version: 2.3.0p12 and 2.3.0p17
OS version: unknown and Debian 11
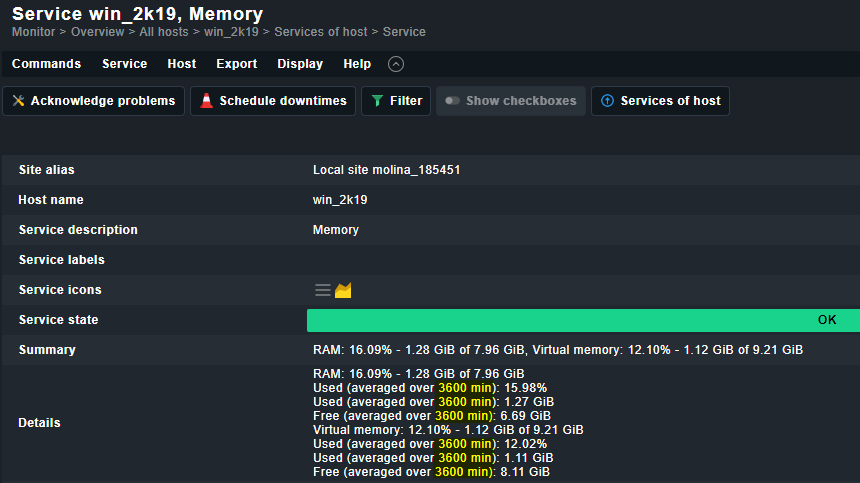
Error message: Customer reported that after setting an averaging value for Windows Memory usage, the value on the service detail page does not match. A 1-hour rule shows as 3600 minutes on the service output.
They are 2.3.0p12. I spun up a clean 2.3.0p17 site with a single Windows host and was able to replicate the issue exactly as they reported.
Is this just a UI label bug, or is the site actually averaging the last 2.5 days of usage? See the attached images for visual evidence of the issue.
Output of “cmk --debug -vvn hostname”: (If it is a problem with checks or plugins)
There is nothing wrong with the agent output itself, but including as requested.
value store: synchronizing
Trying to acquire lock on /omd/sites/test_site/tmp/check_mk/counters/test_win_host
Got lock on /omd/sites/test_site/tmp/check_mk/counters/test_win_host
value store: loading from disk
Releasing lock on /omd/sites/test_site/tmp/check_mk/counters/test_win_host
Released lock on /omd/sites/test_site/tmp/check_mk/counters/test_win_host
Checkmk version 2.3.0p17
+ FETCHING DATA
  Source: SourceInfo(hostname='test_win_host', ipaddress='REDACTED_IPv4', ident='agent', fetcher_type=<FetcherType.TCP: 8>,source_type=<SourceType.HOST: 1>)
[cpu_tracking] Start [7ef3fa5643e0]
Read from cache: AgentFileCache(test_win_host, path_template=/omd/sites/test_site/tmp/check_mk/cache/{hostname}, max_age=MaxAge(checking=0, discovery=90.0, inventory=90.0), simulation=False, use_only_cache=False, file_cache_mode=6)
Not using cache (Too old. Age is 19 sec, allowed is 0 sec)
Connecting via TCP to REDACTED_IPv4:6556 (5.0s timeout)
Detected transport protocol: TransportProtocol.PLAIN
Reading data from agent
Closing TCP connection to REDACTED_IPv4:6556
Write data to cache file /omd/sites/test_site/tmp/check_mk/cache/test_win_host
Trying to acquire lock on /omd/sites/test_site/tmp/check_mk/cache/test_win_host
Got lock on /omd/sites/test_site/tmp/check_mk/cache/test_win_host
Releasing lock on /omd/sites/test_site/tmp/check_mk/cache/test_win_host
Released lock on /omd/sites/test_site/tmp/check_mk/cache/test_win_host
[cpu_tracking] Stop [7ef3fa5643e0 - Snapshot(process=posix.times_result(user=0.0, system=0.0, children_user=0.0, children_system=0.0, elapsed=0.8099999995902181))]
  Source: SourceInfo(hostname='test_win_host', ipaddress='REDACTED_IPv4', ident='piggyback', fetcher_type=<FetcherType.PIGGYBACK: 4>, source_type=<SourceType.HOST: 1>)
[cpu_tracking] Start [7ef3fb3b0fb0]
Read from cache: NoCache(test_win_host, path_template=/dev/null, max_age=MaxAge(checking=0.0, discovery=0.0, inventory=0.0),simulation=False, use_only_cache=False, file_cache_mode=1)
No piggyback files for 'test_win_host'. Skip processing.
No piggyback files for 'REDACTED_IPv4'. Skip processing.
Get piggybacked data
[cpu_tracking] Stop [7ef3fb3b0fb0 - Snapshot(process=posix.times_result(user=0.0, system=0.0, children_user=0.0, children_system=0.0, elapsed=0.010000000707805157))]
[cpu_tracking] Start [7ef3fadaa390]
+ PARSE FETCHER RESULTS
<<<check_mk>>> / Transition NOOPParser -> HostSectionParser
<<<cmk_agent_ctl_status:sep(0)>>> / Transition HostSectionParser -> HostSectionParser
<<<wmi_cpuload:sep(124)>>> / Transition HostSectionParser -> HostSectionParser
<<<uptime>>> / Transition HostSectionParser -> HostSectionParser
<<<fileinfo:sep(124)>>> / Transition HostSectionParser -> HostSectionParser
<<<mem>>> / Transition HostSectionParser -> HostSectionParser
<<<df:sep(9)>>> / Transition HostSectionParser -> HostSectionParser
<<<winperf_phydisk>>> / Transition HostSectionParser -> HostSectionParser
<<<winperf_if>>> / Transition HostSectionParser -> HostSectionParser
<<<winperf_processor>>> / Transition HostSectionParser -> HostSectionParser
<<<logwatch>>> / Transition HostSectionParser -> HostSectionParser
<<<checkmk_agent_plugins_win:sep(0)>>> / Transition HostSectionParser -> HostSectionParser
<<<dotnet_clrmemory:sep(124)>>> / Transition HostSectionParser -> HostSectionParser
<<<services>>> / Transition HostSectionParser -> HostSectionParser
<<<ps:sep(9)>>> / Transition HostSectionParser -> HostSectionParser
Transition HostSectionParser -> NOOPParser
Transition NOOPParser -> NOOPParser
<<<systemtime>>> / Transition NOOPParser -> HostSectionParser
  HostKey(hostname='test_win_host', source_type=<SourceType.HOST: 1>)  -> Add sections: ['check_mk', 'checkmk_agent_plugins_win', 'cmk_agent_ctl_status', 'df', 'dotnet_clrmemory', 'fileinfo', 'logwatch', 'mem', 'ps', 'services', 'systemtime', 'uptime', 'winperf_if', 'winperf_phydisk', 'winperf_processor', 'wmi_cpuload']
  HostKey(hostname='test_win_host', source_type=<SourceType.HOST: 1>)  -> Add sections: []
Received no piggyback data
CPU utilization      Total CPU: 2.19%
Check_MK Agent       Version: 2.2.0p24, OS: windows, TLS is not activated on monitored host (see details), Agent plug-ins: 0, Local checks: 0
Disk IO SUMMARY      Read: 0.00 B/s, Write: 159 kB/s, Latency: 729 microseconds
Filesystem C:/       Used: 19.02% - 12.1 GiB of 63.4 GiB, trend per 1 day 0 hours: +1.10 GiB, trend per 1 day 0 hours: +1.74%, Time left until disk full: 46 days 13 hours
Interface 1          [Red Hat VirtIO Ethernet Adapter], (up), Speed: 10 GBit/s, In: 78.1 B/s (<0.01%), Out: 1.22 kB/s (<0.01%)
Memory               RAM: 18.15% - 1.45 GiB of 7.96 GiB, Virtual memory: 13.58% - 1.25 GiB of 9.21 GiB
Processor Queue      15 min load: 0.00, 15 min load per core: 0.00 (4 logical cores)
No piggyback files for 'test_win_host'. Skip processing.
No piggyback files for 'REDACTED_IPv4'. Skip processing.
[cpu_tracking] Stop [7ef3fadaa390 - Snapshot(process=posix.times_result(user=0.010000000000000009, system=0.0, children_user=0.0, children_system=0.0, elapsed=0.0))]
[agent] Success, [piggyback] Success (but no data found for this host), execution time 0.8 sec | execution_time=0.820 user_time=0.010 system_time=0.000 children_user_time=0.000 children_system_time=0.000 cmk_time_agent=0.820