We have the same issue, just as the original post describes. Had it happening when using CheckMK version 1.6.0p24, and now that we have CheckMK 2.2.0p3, it is still happening.
Over the past month, I’ve run a test to verify this. I created two Windows 10 virtual machines:
- TEST_WITH
- TEST_WITHOUT
The machines are nearly identical, being created from the same VM template. After they were created, they got all existing Windows updates, and the CheckMK agent was applied to both… except for one difference: the machine “TEST_WITH” has the Windows update plugin, which TEST_WITHOUT does not. Neither machine has been doing anything, other than nightly backups by the Rubrik VM backup system.
Why do this test? I’ve been seeing for a long time that our Windows servers monitored in CheckMK would run out of RAM, and the memory usage service graph would all show a steady uptick in usage over a matter of days, as if there is a memory leak. If I open Task Manager on one of the problem machines, it will show something like this:
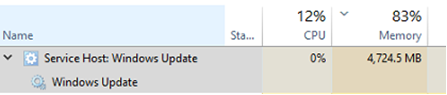
Restart the computer, and memory usage is normal – for a while – but creeps upward. This needed to be tested to be sure, so I setup these two VMs with the only being their IP addresses (unavoidable but decidedly immaterial to the test), and the presence or absence of the Windows update plugin for CheckMK.
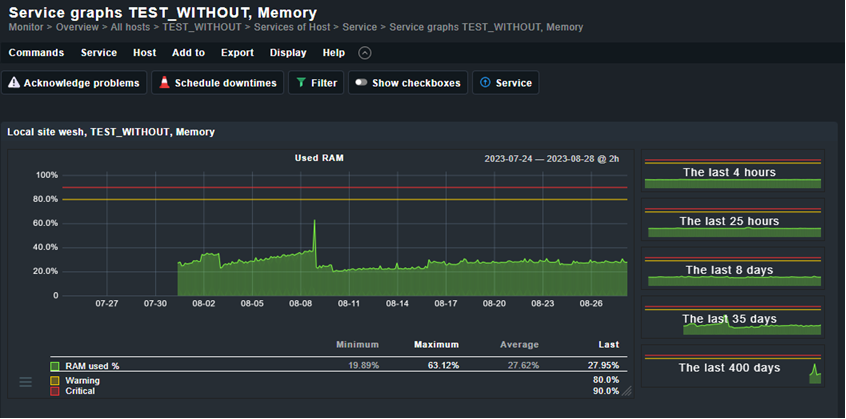
Here is TEST_WITHOUT memory graph for the past 35 days:
As you can see, it has reached a steady-state of RAM usage and has held there. Task Manager on this machine shows the Windows Update service process like this:
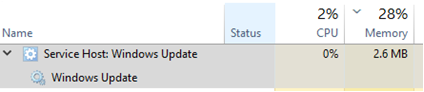
This seems pretty normal.
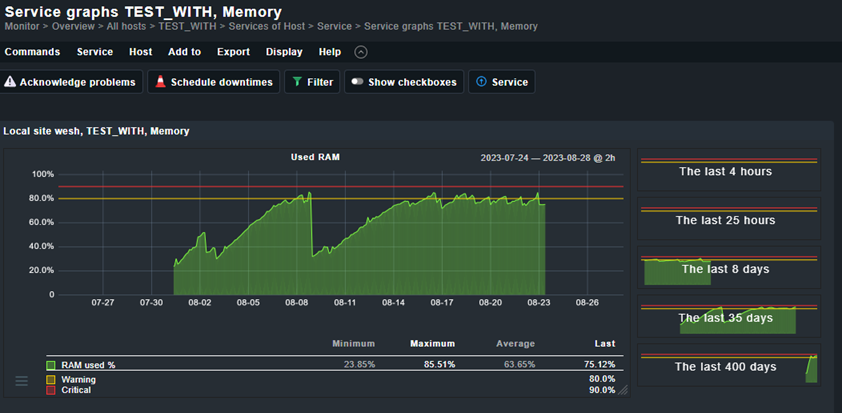
On the TEST_WITH machine over the same 35 day time period, this is how the service graph looks:
I believe the drop-off in memory usage for both systems on 8/9 was due to a restart of both systems that day.
Interestingly, the memory service graph drops out on 8/23, and a check of Task Manager on this machine looks normal, though obviously the CheckMK agent isn’t reporting back. Note: this is unusual behavior. Normally the machines become so burdened with the lack of RAM that they simply stop functioning, to the point they won’t even display video on the VM, requiring a hard power reset.
Here is the check_mk.user.yml file on TEST_WITH:
---
global:
  enabled: true
plugins:
  enabled: true
  execution:
    - pattern: $CUSTOM_PLUGINS_PATH$\windows_udpates.vbs
      run: yes
      cache_age: 900
      async: yes
      timeout: 120
      retry_count: 3
logwatch:
  enabled: false
  sendall: false
  vista_api: no
  skip_duplicated: true
  max_size: 500000
  max_line_length: -1
  max_entries: -1
  timeout: -1
  logfile:
    - "*": off context
    - Parameters: ignore
    - State: ignore
Here is that same file on TEST_WITHOUT (spoiler: the files are identical):
---
global:
  enabled: true
plugins:
  enabled: true
  execution:
    - pattern: $CUSTOM_PLUGINS_PATH$\windows_udpates.vbs
      run: yes
      cache_age: 900
      async: yes
      timeout: 120
      retry_count: 3
logwatch:
  enabled: false
  sendall: false
  vista_api: no
  skip_duplicated: true
  max_size: 500000
  max_line_length: -1
  max_entries: -1
  timeout: -1
  logfile:
    - "*": off context
    - Parameters: ignore
    - State: ignore
I’ve checked with the IT manager at another of our business offices in another state, and he reports seeing the same thing on his VMs there. This isn’t an isolated issue, but not a well reported issue.
My suspicion is that the windows_update.vbs plugin runs but doesn’t free up all the resources it uses, then runs again a few minutes later, and again, and again, each time building up the amount of resources being consumed, a classic memory leak.