Hi,
I have many http checks for monitor websites for changes.
Here is a example conf:
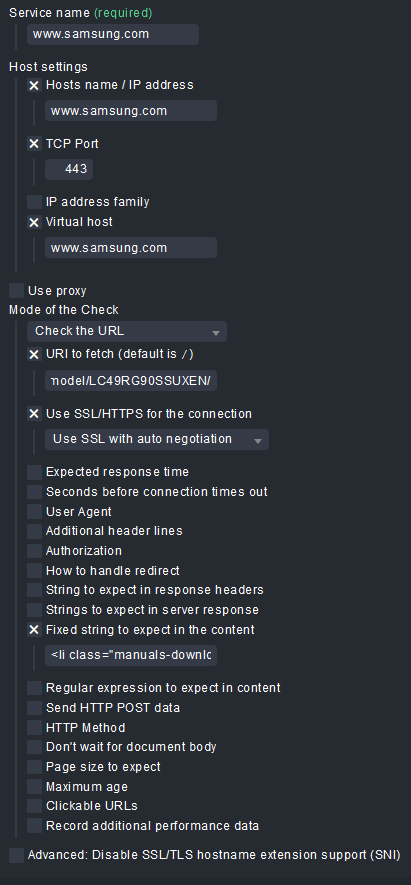
As url I use: /de/support/model/LC49RG90SSUXEN/
But the check fails with:
HTTP CRITICAL: HTTP/1.1 200 OK - string '<li
class="manuals-downloa...' not found on
(https://www.samsung.com:443/de/support/model/LC49RG90SSUXEN/')
- 369312 bytes in 0.424 second response time
I don’t know where check mk adds the ' at the end.
Only 2 http checks are working, I don’t know why (I created the working checks long time before the other one).
I created a host to summerize these checks. It has 127.0.0.1 as ip. I moved the http checks to another “real” client, but this changed nothing.
My cmk version is 2.0.0p15
I’m using this plugin: HTTP/HTTPS Connection
Output from cmk --debug -vvn host:
OMD[monitoring]:~$ cmk --debug -vvn Webseitenueberwachung
Checkmk version 2.0.0p15
Try license usage history update.
Trying to acquire lock on /omd/sites/monitoring/var/check_mk/license_usage/next_run
Got lock on /omd/sites/monitoring/var/check_mk/license_usage/next_run
Trying to acquire lock on /omd/sites/monitoring/var/check_mk/license_usage/history.json
Got lock on /omd/sites/monitoring/var/check_mk/license_usage/history.json
Next run time has not been reached yet. Abort.
Releasing lock on /omd/sites/monitoring/var/check_mk/license_usage/history.json
Released lock on /omd/sites/monitoring/var/check_mk/license_usage/history.json
Releasing lock on /omd/sites/monitoring/var/check_mk/license_usage/next_run
Released lock on /omd/sites/monitoring/var/check_mk/license_usage/next_run
+ FETCHING DATA
  Source: SourceType.HOST/FetcherType.PIGGYBACK
[cpu_tracking] Start [7f971b860e80]
No piggyback files for 'Webseitenueberwachung'. Skip processing.
No piggyback files for '127.0.0.1'. Skip processing.
[PiggybackFetcher] Fetch with cache settings: NoCache(base_path=PosixPath('/omd/sites/monitoring/tmp/check_mk/data_source_cache/piggyback/Webseitenueberwachung'), max_age=MaxAge(checking=0, discovery=120, inventory=120), disabled=False, use_outdated=False, simulation=False)
[PiggybackFetcher] Execute data source
[cpu_tracking] Stop [7f971b860e80 - Snapshot(process=posix.times_result(user=0.0, system=0.0, children_user=0.0, children_system=0.0, elapsed=0.0))]
[cpu_tracking] Start [7f971b860ac0]
+ PARSE FETCHER RESULTS
  Source: SourceType.HOST/FetcherType.PIGGYBACK
No persisted sections loaded
  -> Add sections: []
Received no piggyback data
Loading item states
Trying to acquire lock on /omd/sites/monitoring/tmp/check_mk/counters/Webseitenueberwachung
Got lock on /omd/sites/monitoring/tmp/check_mk/counters/Webseitenueberwachung
Releasing lock on /omd/sites/monitoring/tmp/check_mk/counters/Webseitenueberwachung
Released lock on /omd/sites/monitoring/tmp/check_mk/counters/Webseitenueberwachung
No piggyback files for 'Webseitenueberwachung'. Skip processing.
No piggyback files for '127.0.0.1'. Skip processing.
[cpu_tracking] Stop [7f971b860ac0 - Snapshot(process=posix.times_result(user=0.010000000000000009, system=0.0, children_user=0.0, children_system=0.0, elapsed=0.0))]
execution time 0.0 sec | execution_time=0.000 user_time=0.010 system_time=0.000 children_user_time=0.000 children_system_time=0.000 cmk_time_agent=0.000
Even if I try to monitor google, the ' are added.