Can you please post a small screenshot of the interfaces?
If possible, you can also sent the section of the interfaces from the agent output to me.
Sent both in a PM. I can regenerate the -d output easily enough if you need all of it.
Ok problem found - i need to add the status StandbyOffline to the ignored states at discovery time.
Is that something I can change on the installed mkp or do I have to wait till I can update the package?
You can add this state to the check for the Ethernet interfaces. Inside the discovery function you see a list of ignored states.
New version for 2.3 is already on github available.
Trying to inventory using 2.3.57 and I’m getting this:
[special_redfish] redfish.rest.v1.RetriesExhaustedErrorCRIT, [piggyback] Success (but no data found for this host), execution time 17.0 sec
Details Agent exited with code 1: Agent failed - please submit a crash report! (Crash-ID: a6a7aab0-5407-11ef-ac33-1418774a732c)

Traceback (most recent call last):
File "/omd/sites/sitename/local/lib/python3/urllib3/connectionpool.py", line 467, in _make_request
six.raise_from(e, None)
File "<string>", line 3, in raise_from
File "/omd/sites/sitename/local/lib/python3/urllib3/connectionpool.py", line 462, in _make_request
httplib_response = conn.getresponse()
^^^^^^^^^^^^^^^^^^
File "/omd/sites/sitename/lib/python3.12/http/client.py", line 1428, in getresponse
response.begin()
File "/omd/sites/sitename/lib/python3.12/http/client.py", line 331, in begin
version, status, reason = self._read_status()
^^^^^^^^^^^^^^^^^^^
File "/omd/sites/sitename/lib/python3.12/http/client.py", line 292, in _read_status
line = str(self.fp.readline(_MAXLINE + 1), "iso-8859-1")
^^^^^^^^^^^^^^^^^^^^^^^^^^^^^^
File "/omd/sites/sitename/lib/python3.12/socket.py", line 707, in readinto
return self._sock.recv_into(b)
^^^^^^^^^^^^^^^^^^^^^^^
File "/omd/sites/sitename/lib/python3.12/ssl.py", line 1252, in recv_into
return self.read(nbytes, buffer)
^^^^^^^^^^^^^^^^^^^^^^^^^
File "/omd/sites/sitename/lib/python3.12/ssl.py", line 1104, in read
return self._sslobj.read(len, buffer)
^^^^^^^^^^^^^^^^^^^^^^^^^^^^^^
TimeoutError: The read operation timed out
~
There’s another traceback that says while handling the above , and then a third below that also.
I reenable 2.3.38 and it starts working again.
This is a Dell - if yes please disable in the agent settings the firmware inventory for this device.
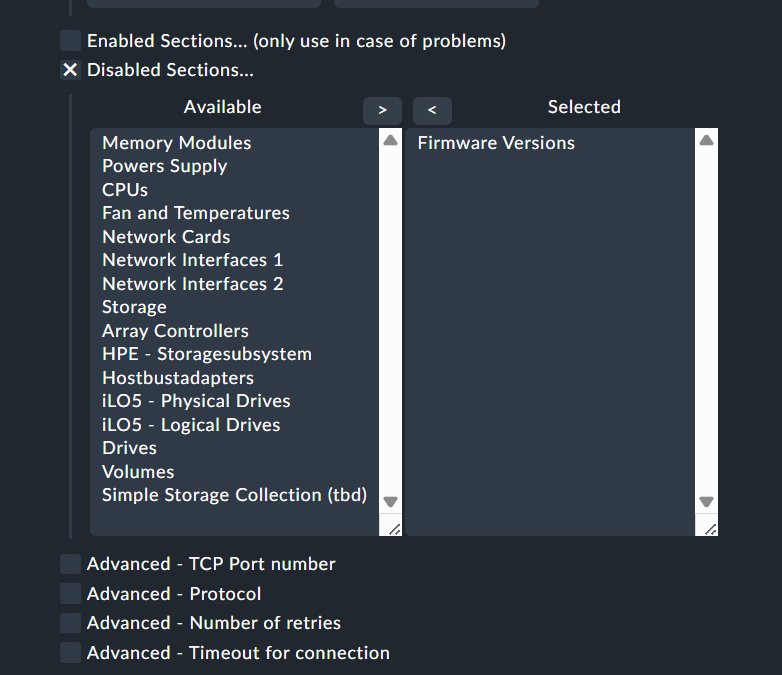
I had today some Dell servers where firmware inventory was only working if higher timeouts than the default 3 seconds are defined.
Not sure if this thread is active now when Redfish is included in Checkmk.
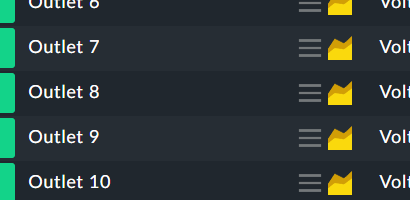
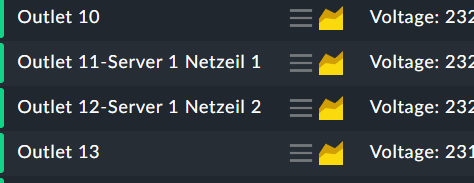
Anyhow we are using the PDU checks for Raritan PDUs and would like to see the actual names of the outlets and not “outlet X” in the service description.
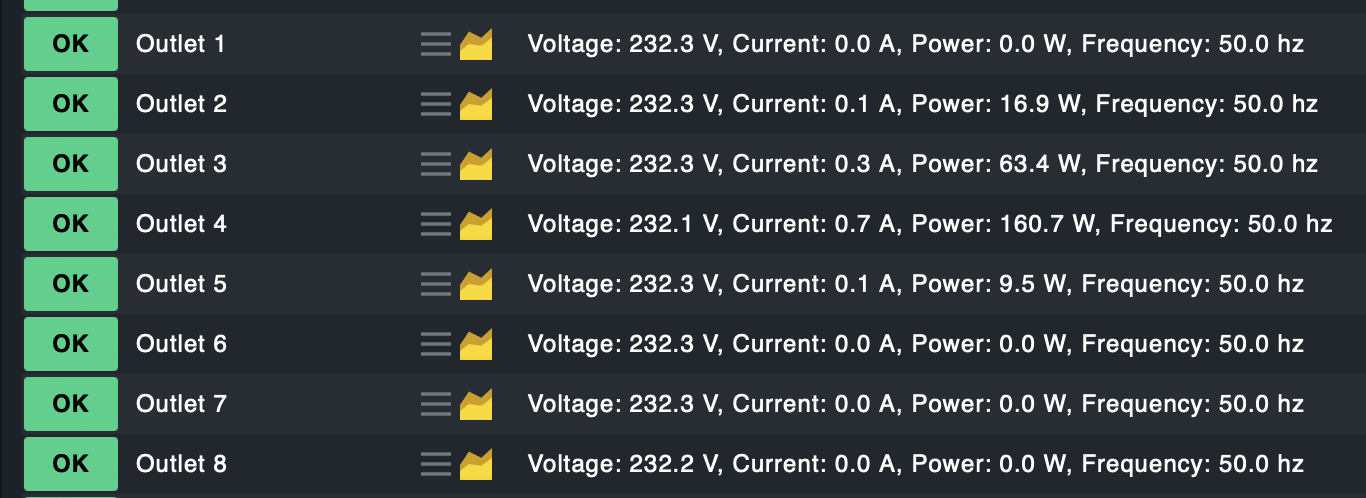
From Checkmk
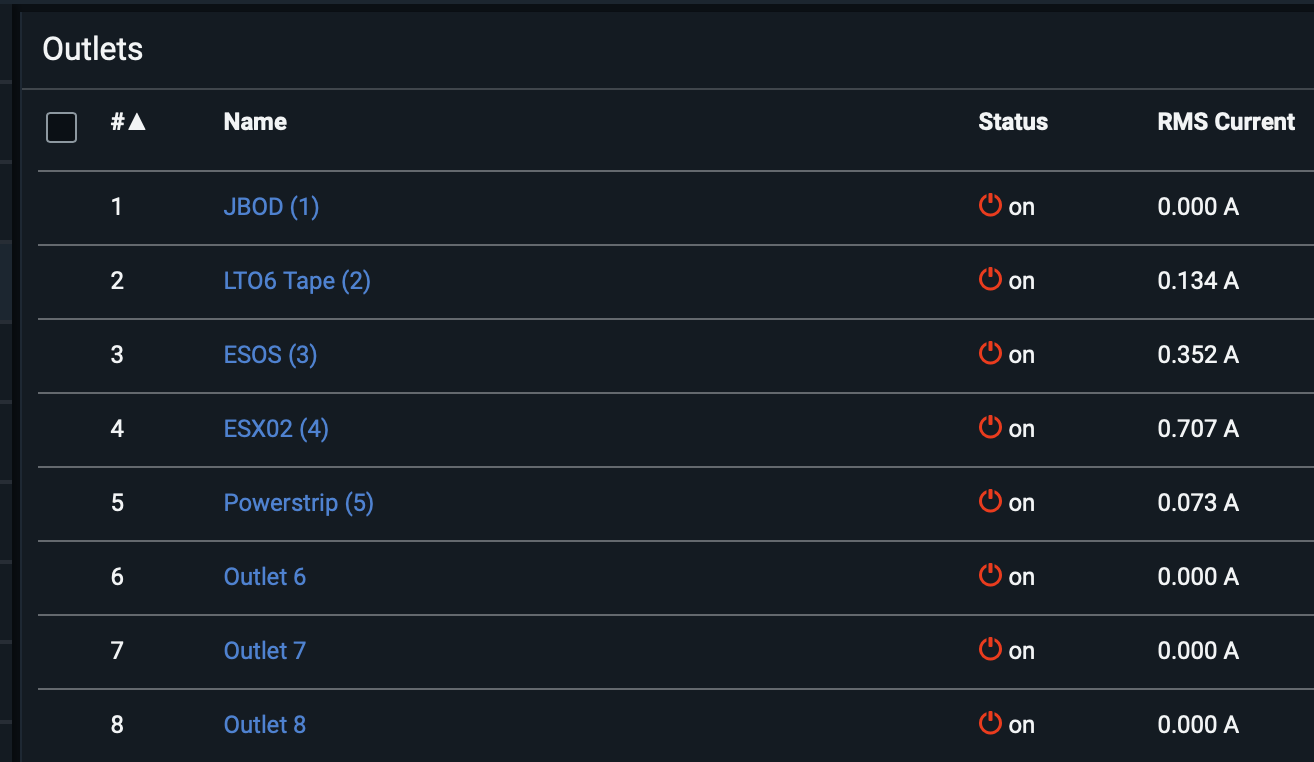
From PDU
It should be possible to have the names there.
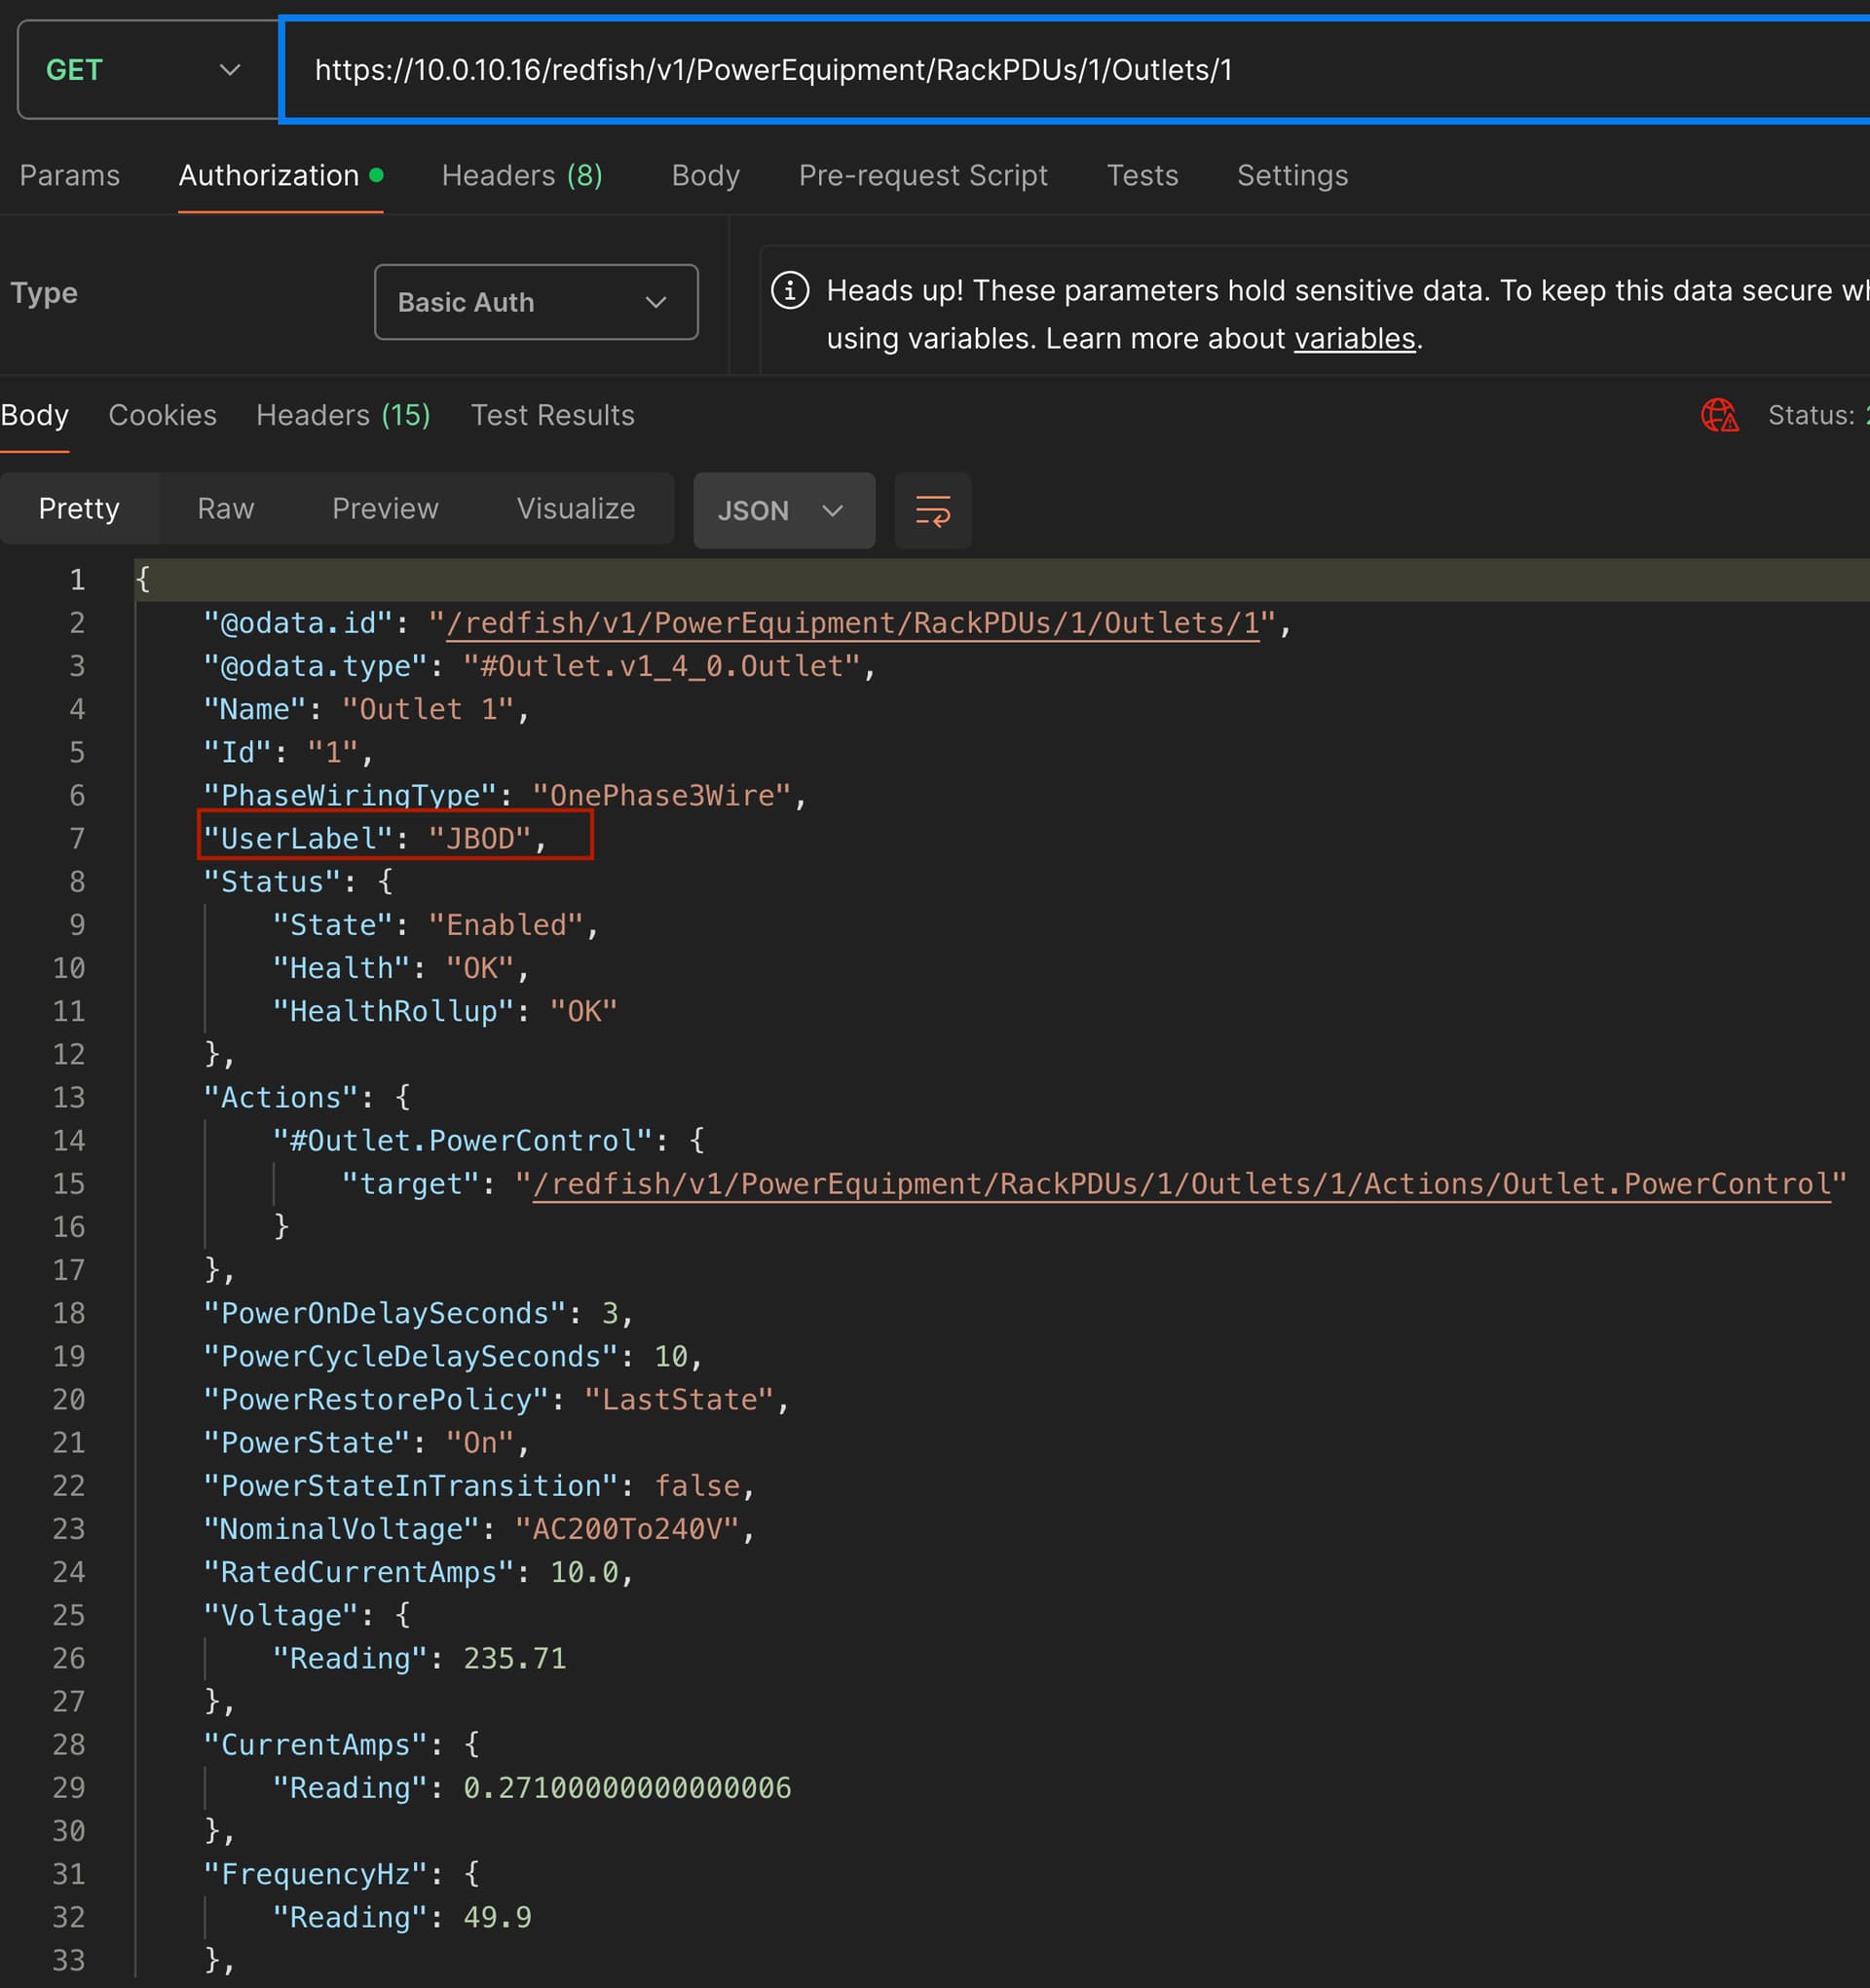
If you can provide me a Redfish dump from such an device i can inspect where to find the names.
As the PDU function is not included inside the shipped CMK package you can say this part is really beta ![]()
1 Like
Sure, it seems it’s called UserLabel
It would also be nice if EnergykWh[Reading] could be included as performance data
and RatedCurrentAmps in the details
Was not sure what version added the PDU readings as checkmk ships with 2.3.38 ![]()
Thank you for your work and effort, Andreas!
We are testing the plugin on our Dell servers, and it works well. (Except we had to increase the plugin timeout due to the “firmware version.”)
However, my colleagues are missing performance data from the interfaces they usually get when querying iDracs via SNMP. Can this be done with the Redfish plugin too?
For the firmware problem with Dell i have also only the recommendation to switch it of or increase the timeout at the moment. The reason is the very big firmware table on these devices. This will be better in the near future if i can implement the caching for some sections. Then you can say to only fetch specific data at an greater interval and not every time.
Can you provide an output of your current system with such an problem.
Keep in mind that the performance data shown with SNMP comes not from the management board itself. These data is provided via agentless managment service from host OS.
2 Likes
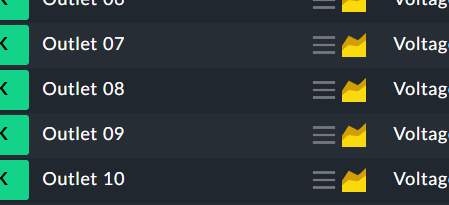
Implemented now three different naming options.
- Index - like it is now
- UserLabel - it is Index-UserLabel
- Index with zfill
Energy kWh output is also implemented

https://github.com/Yogibaer75/Check_MK-Things/raw/master/check%20plugins%202.3/redfish/redfish-2.3.58.mkp
3 Likes
Thanks @andreas-doehler
It works very well and great that you made a discovery rule so people can configure this.
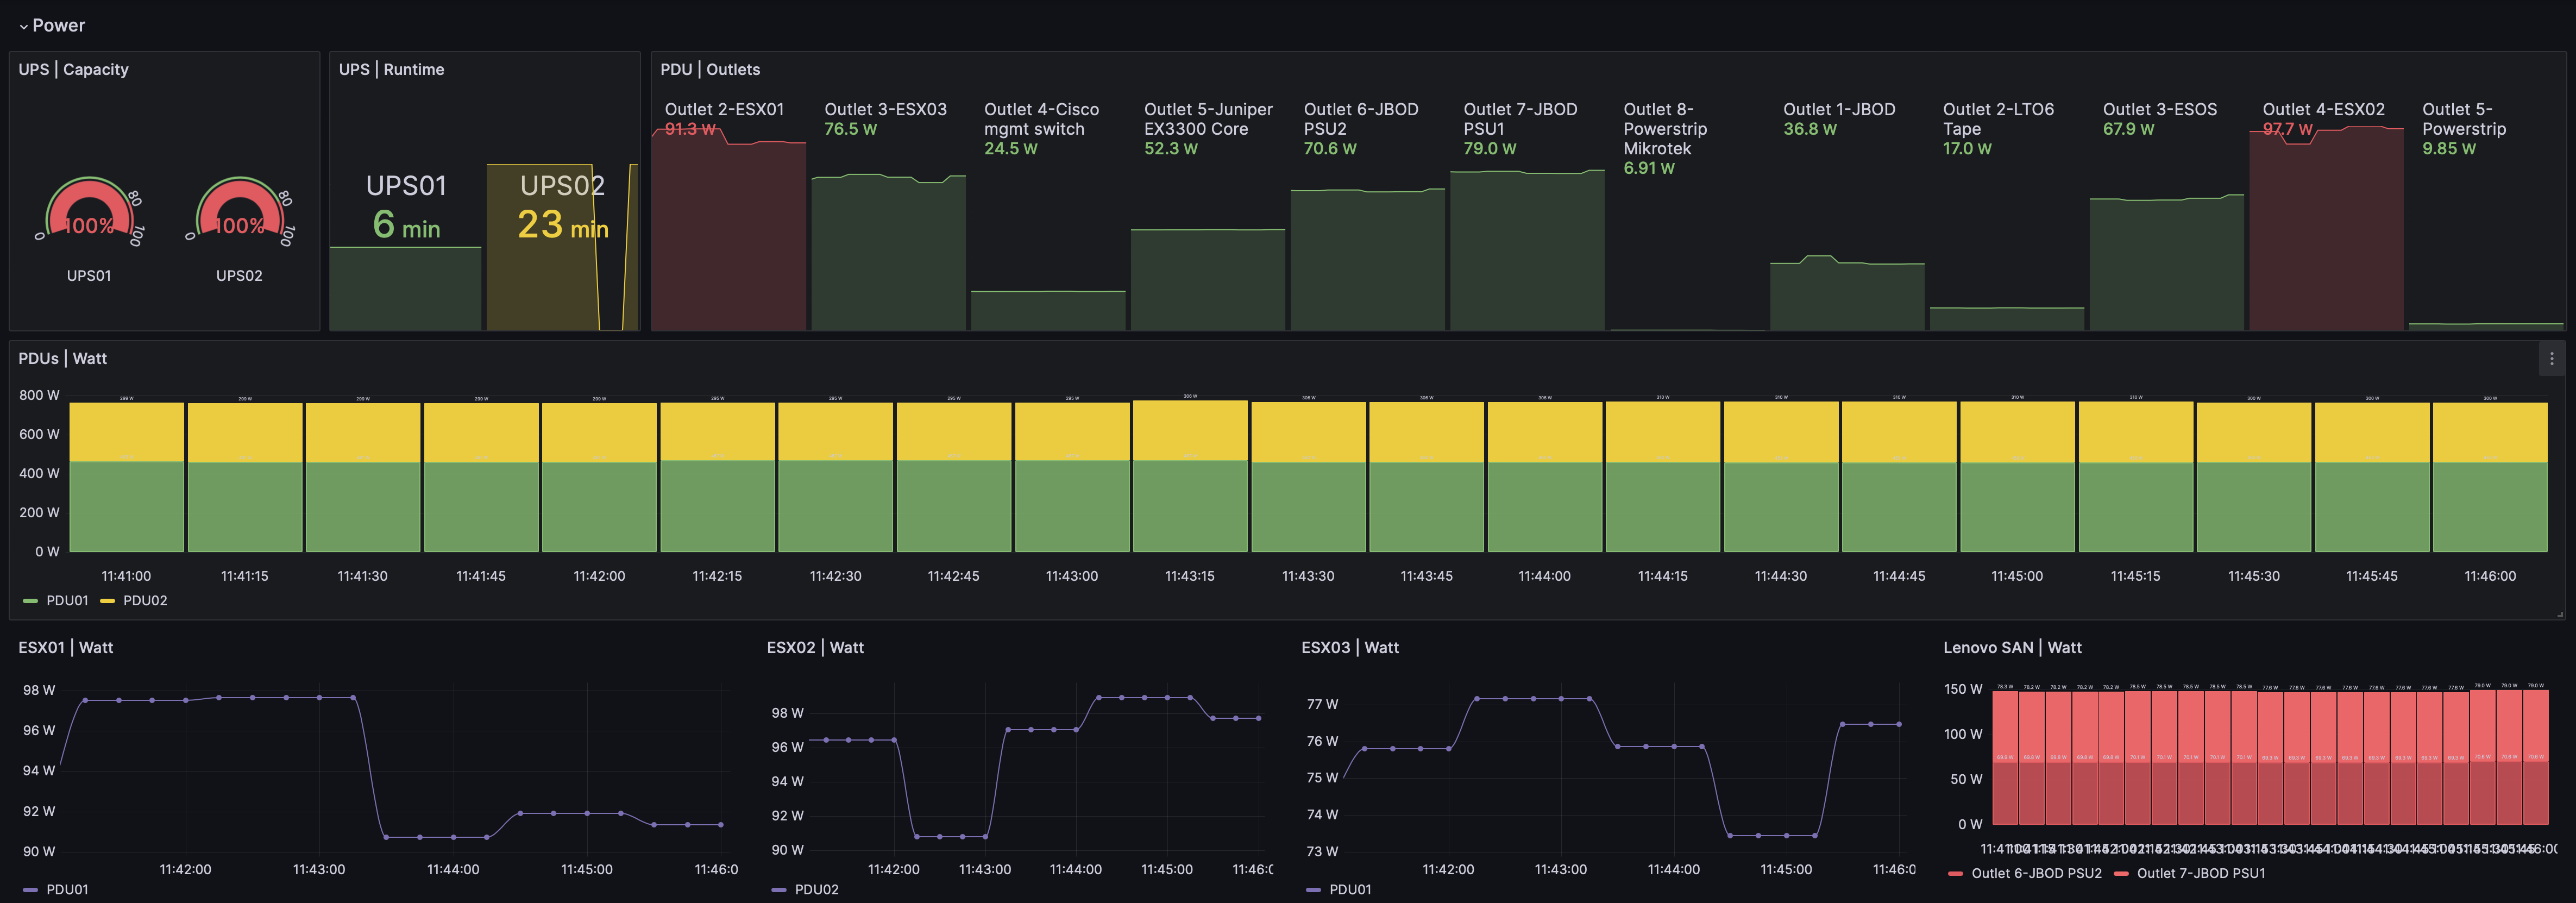
Now I don’t have to translate service descriptions and Grafana looks nice in my homelab
2 Likes
I do not want to derail the thread, but you should share the dashboard, it looks great!
1 Like
Thanks @robin.gierse
It’s not really that much going on but I like the idea of having visualization done in Grafana for things that are not really “event triggering”.
I’m currently working on a “self monitoring” dashboard for Checkmk and most of the OMD.* Performance data. It looks amazing ![]()
1 Like
hi,
we have a new Ciara servers (actually it is ASUS RS720-E11-RS12U). The redfish monitoring works well with them, except that it does not recognize the power supply status correctly. See screenshot.
I have generated a redfish dump from the machine, how should I share it.
I have already one dump from such a system. That’s the reason for the “unsupported status” message ![]()
Here it is normally a software problem from ASUS as they don’t follow the specification.
I would contact my vendor and request a change of the mainboard until it is fixed. There i had one ASUS system with one PSU with correct state and the second PSU with wrong state.
Thanks for the answer.
Unfortunately, this is not the only time they have not follow the specifications for the machine (all OCP Karen are installed incorrectly and therefore overheat)
Replacing the motherboard will not be so easy. We have 150 of these servers and they all show the error.
but I will report this to support, mybe it will be fixed