While that is being reviewed, i am trying to debug the latency being observed in navigating though the charts on central site connecting sites in other locations.
Use case is , users login to central site and need to access charts for services located in other sites
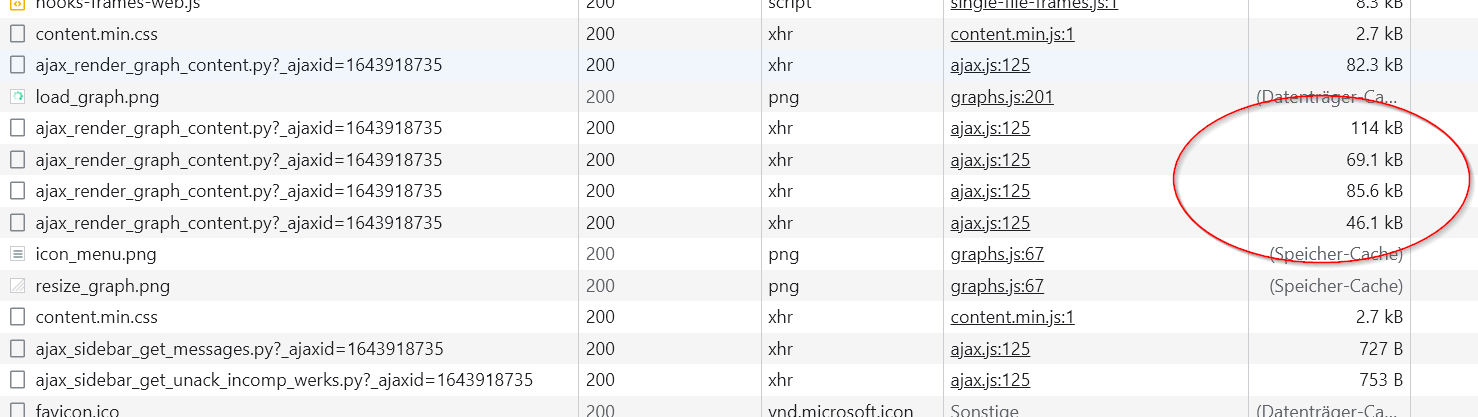
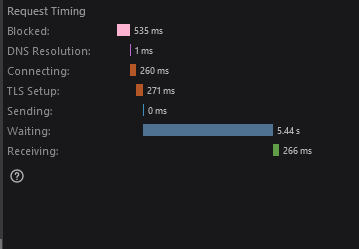
I am seeing a consistent latency of 5 Second in waiting time on the below page call
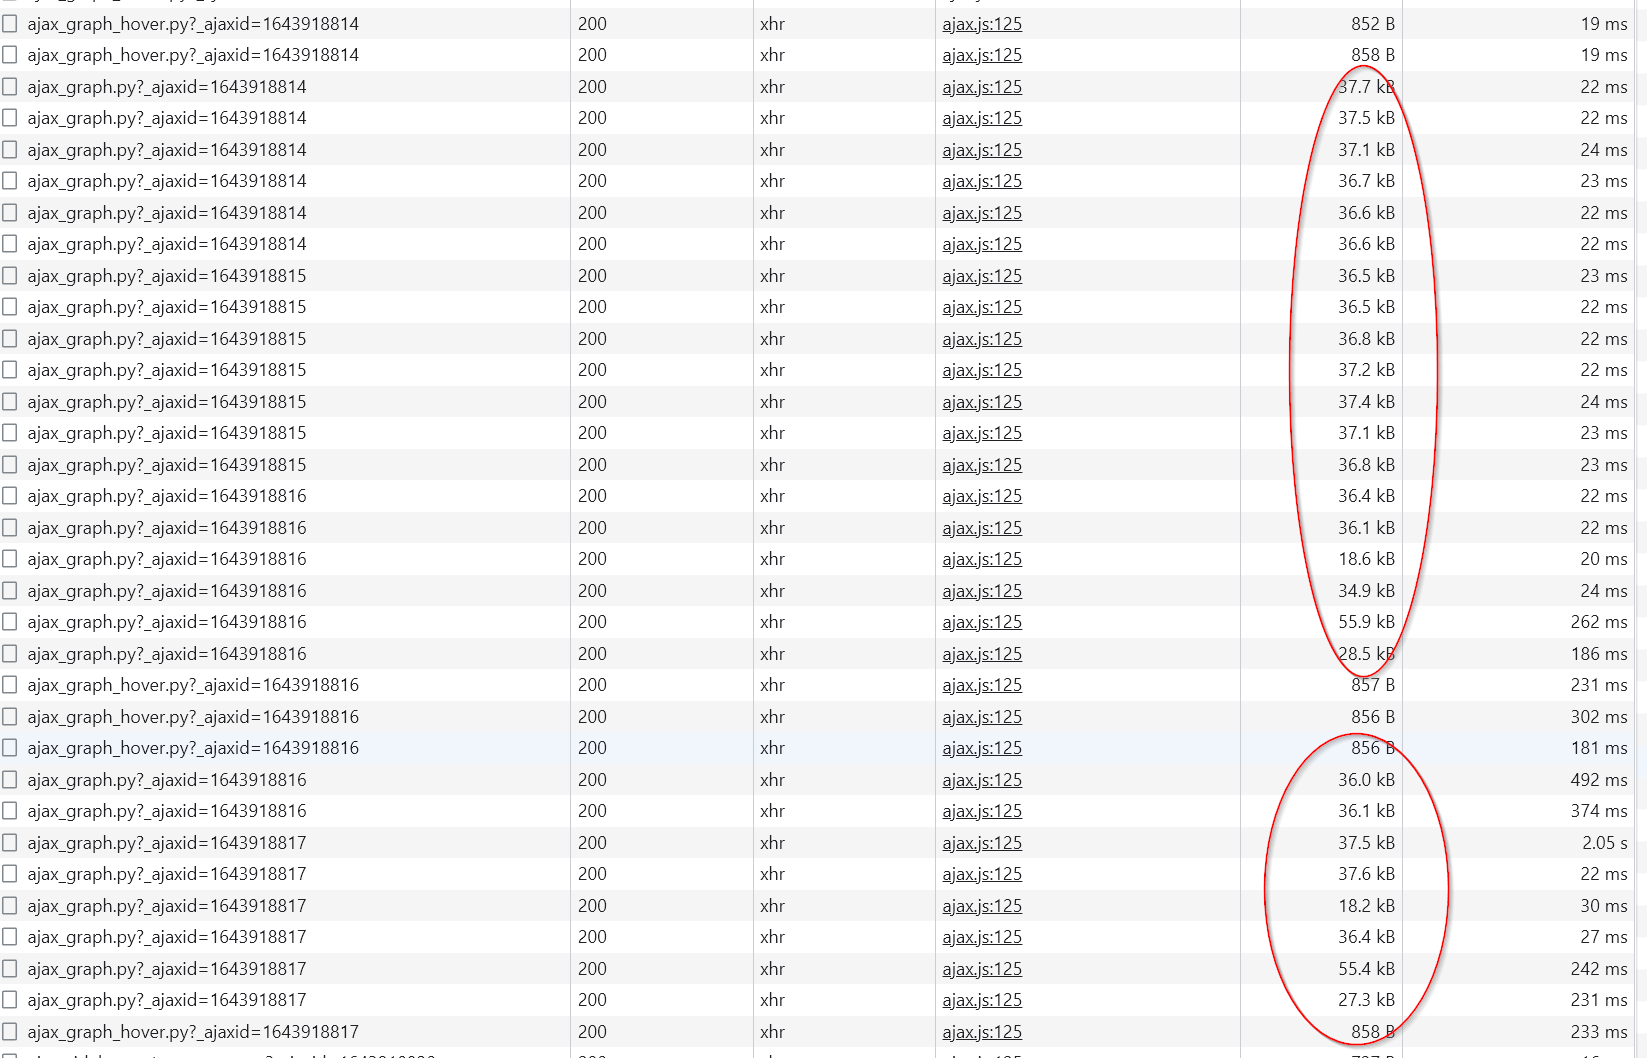
If i understand it correctly , whenever there is a movement of mouse on the chart a fresh set of parameters is downloaded and the image is adjusted accordingly in the chart section.
My question is, can we optimize this response by adjusting / fine tuning the caching somewhere ?
Current wait time is letting the experience down as it take far too long to visually see the change on chart.
Could you point us to the team / resource who may be able to help in this regards. We have been struggling to get the charts working for some time and the cutover coming up soon
There seems to be an interesting change here, the Version 1 seems to open the graphs in the local site and Version 2 seems to open it in the same site ( This would add to the physical distance between two sites and increase the time multi-fold )
That only looks so. Also v1 pulls the graph data from the remote site. But the big difference is the how it fetches the data. Raw edition v1 uses PNP4Nagios and fetches the graph as an rendered PNG. That means only the PNG is transferred from your remote site to the local web server.
v2 uses the enterprise graphing system. This fetches the graph data as ajax request in form of a json data structure.
The problem now is that if you move the mouse over the graph and click you fire the next ajax request and fetch the graph data again. These are easily 100 requests if you scroll a little bit inside the graph.
Here it is a real problem (enterprise and raw) in the direction of @elias.voelker or @sebkir
With this it is clear if you access graphs over continents then it will not work.
Grafana as example only reloads the data after you submit the new timeframe.
Moving the mouse over the graph produce no traffic this is also different with CMK graphing.
This topic was automatically closed 365 days after the last reply. New replies are no longer allowed. Contact an admin if you think this should be re-opened.
 , will review the performance and get back to you