Checkmk 2.5 is officially released. Thank you to everyone who joined the community calls, tested the beta, reported bugs, and shared feedback along the way.
A short overview of what’s new:
A more intuitive UI — global search across Setup and Monitoring, clearer error messages, and guided workflows for longer operations like baking agents or adding hosts
Rebuilt dashboards — responsive layouts in the commercial editions, a widget preview before saving, and shareable links for people outside Checkmk
OpenTelemetry support (Cloud and Ultimate) — push metrics via OTLP or scrape Prometheus endpoints, and correlate application and infrastructure data in one place
Improved virtualization and cloud monitoring — a completely reworked Azure integration, expanded Proxmox coverage, new checks for Hyper-V and native Podman support
Checkmk Relay (Cloud and Ultimate) — a lightweight container for monitoring remote or segmented networks without a full remote site
“Explain with AI” (Cloud) — one-click plain-language explanations of alerts
You can also go to play.checkmk.com to see how it looks like.
The ‘Setup’ area is deactivated - but we added a couple of dashboards under ‘Applications’ in ‘Monitor’ called ‘Astronomy shop: …’. They showcase the new Open Telemetry integration utilizing our new metric backend.
Yes. It’s the same. Running a Kubernetes cluster.
I gave now all ‘guest’ users the permission to create custom graphs. With that you can access the backend and see how this works.
I am trying to get something going with otel and I am really struggling, is there anyway you could show some example configurations for the metric backend rules?
If I have a bunch of devices with exporters sending me data, when I create metric backend rule, how does it associate with a device in checkmk? does there need to be a hostname metric coming through that matches the host in checkmk?
In the beginning the received data just runs into the Clickhouse database. Then you have to decide whether to use the data to generate hosts and services via DCD or pick a bunch of metrics via special agent rules and attach them as services to a host:
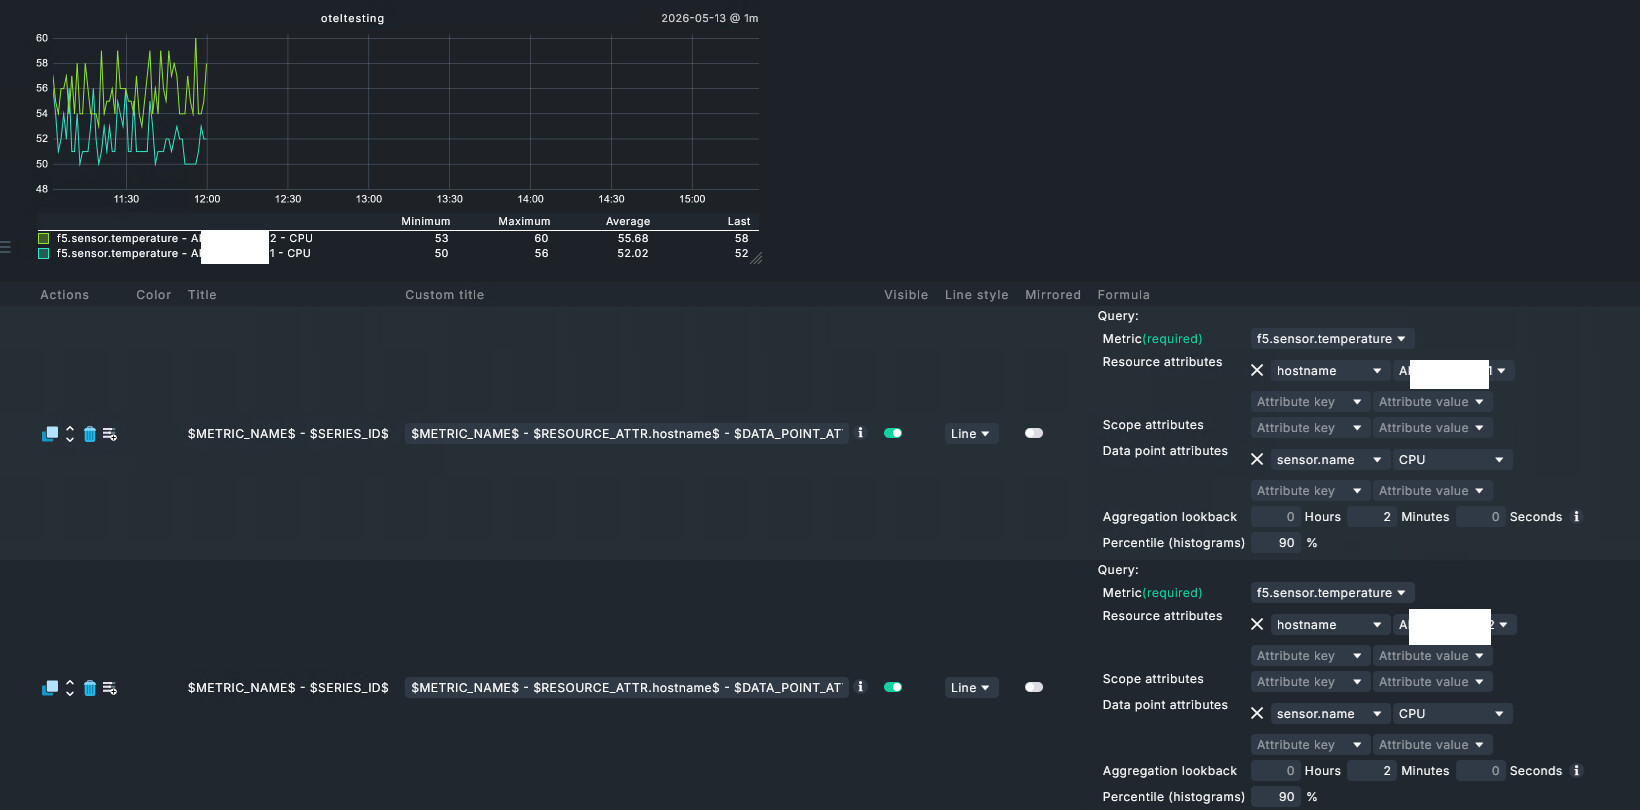
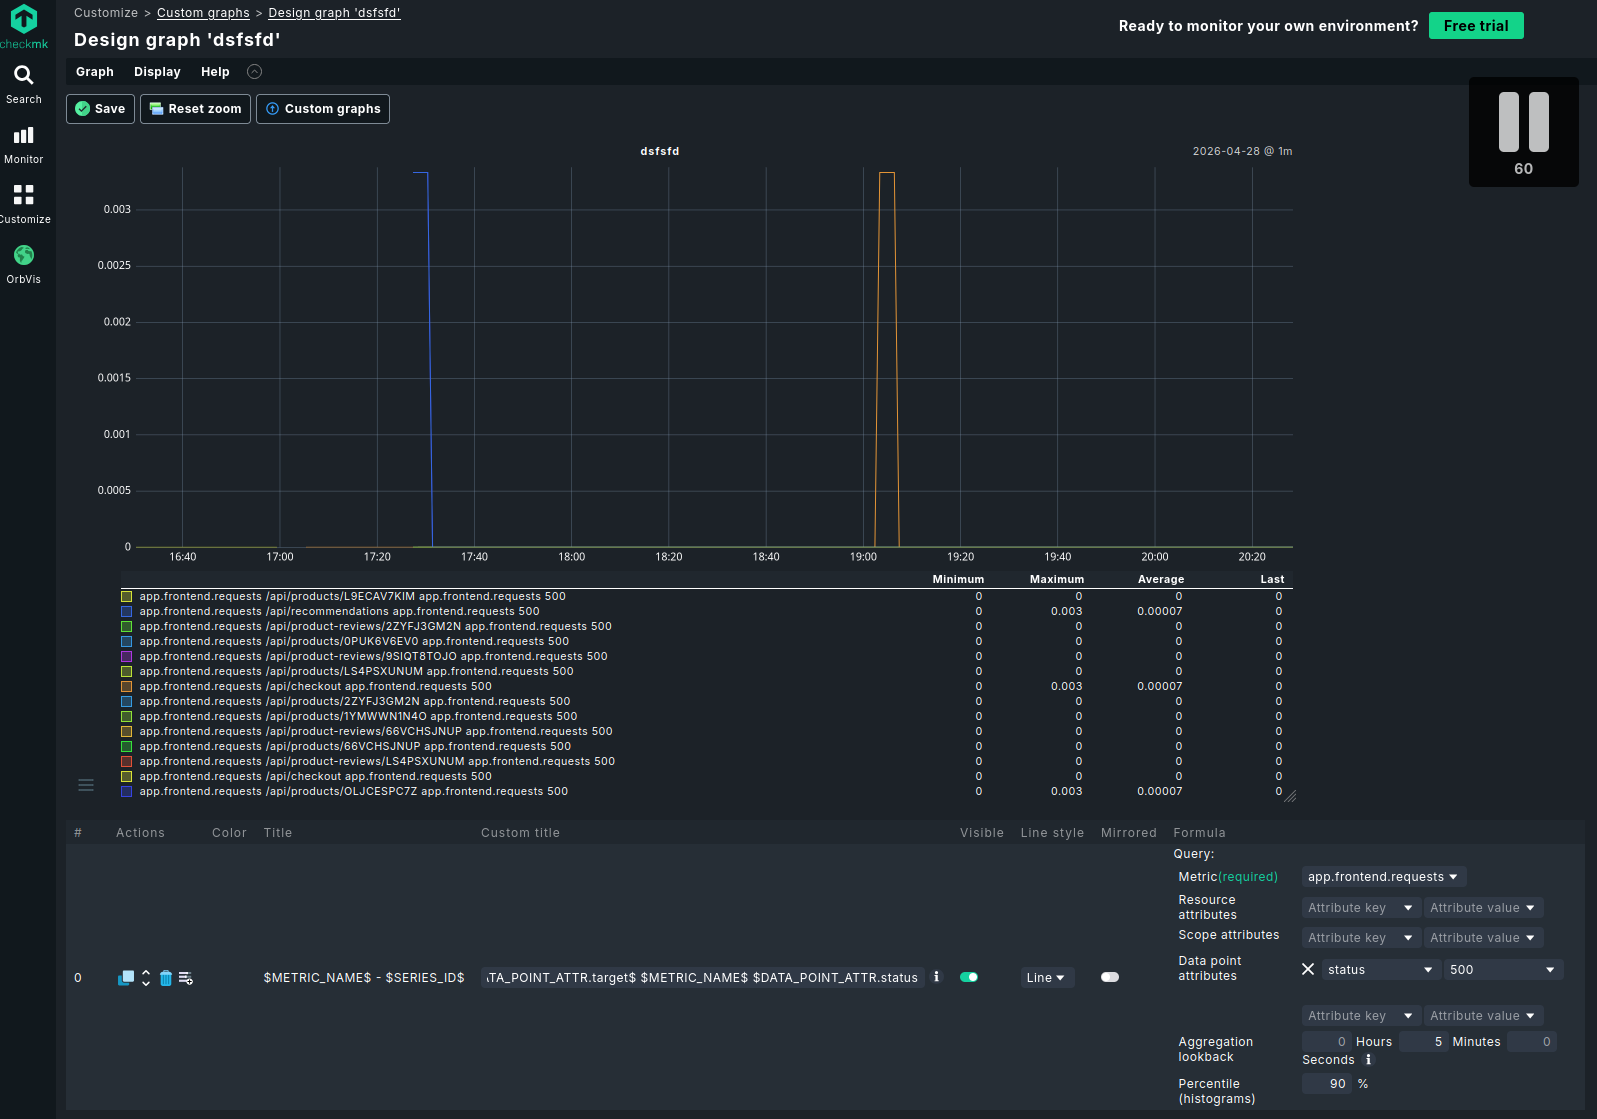
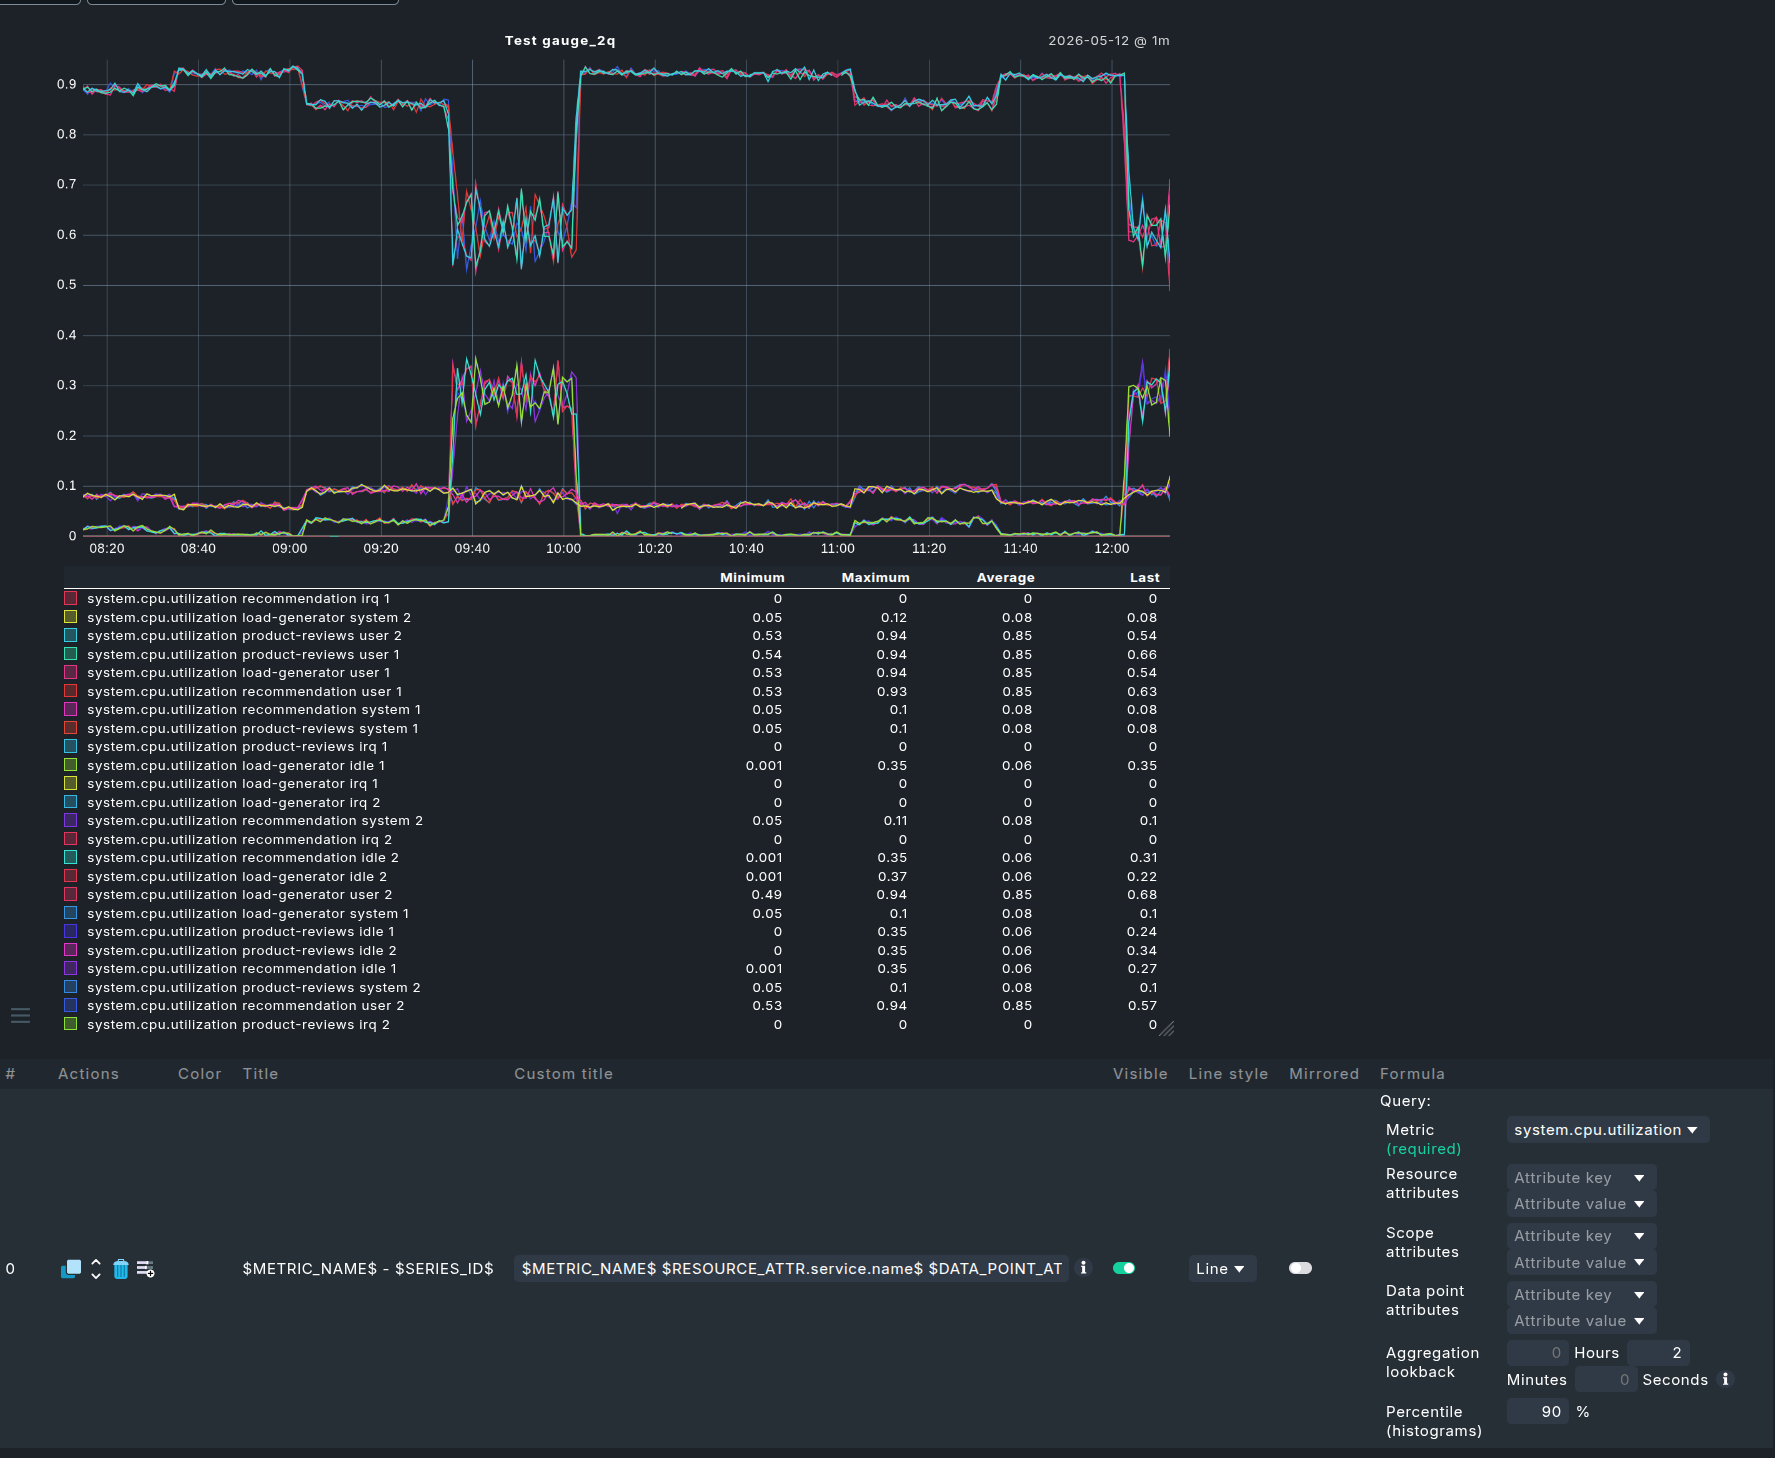
I typically start with a ‘Customize’ → ‘Custom graphs’ → ‘Add graph’
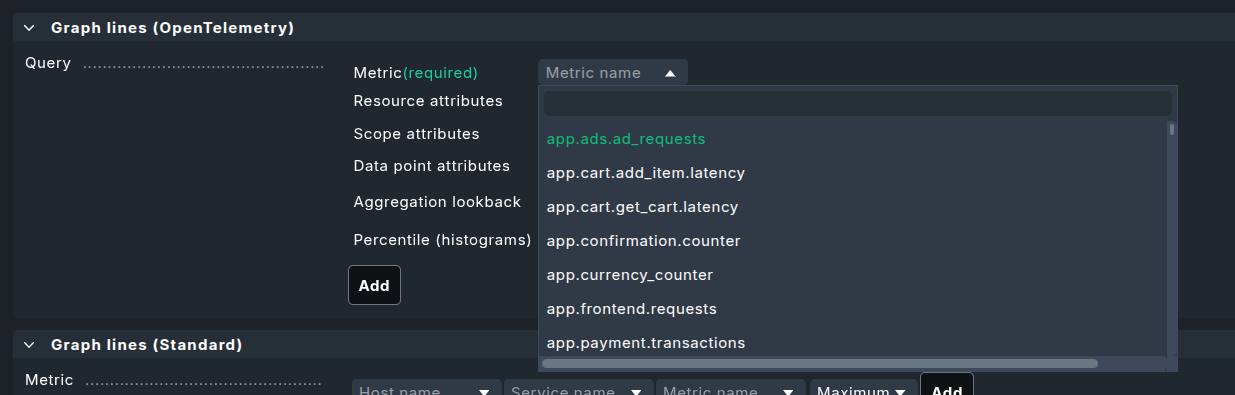
Then I select ‘Graph lines Open Telemetry’ to see what metrics I get and how it looks like:
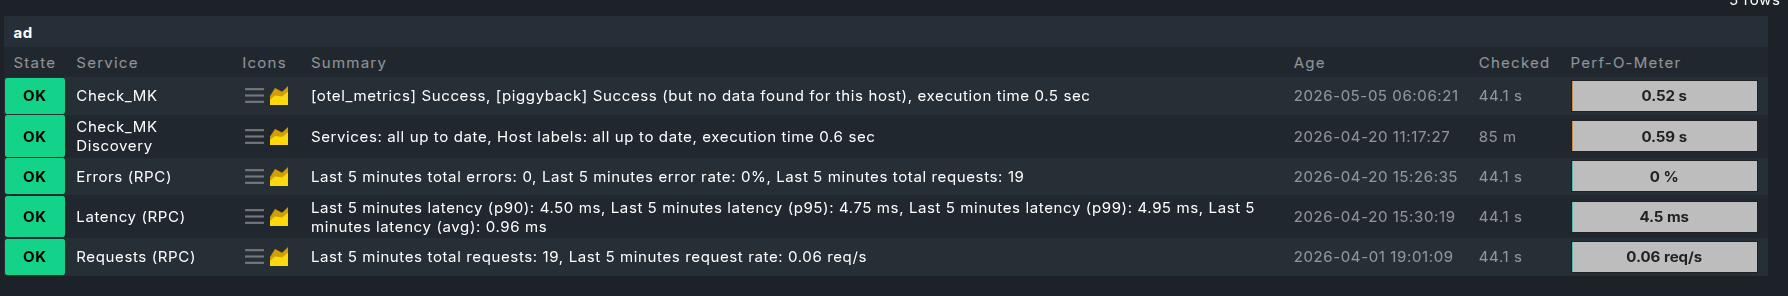
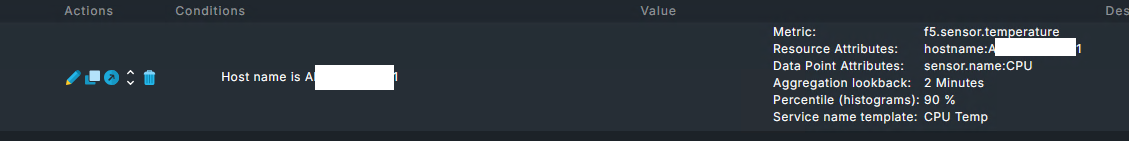
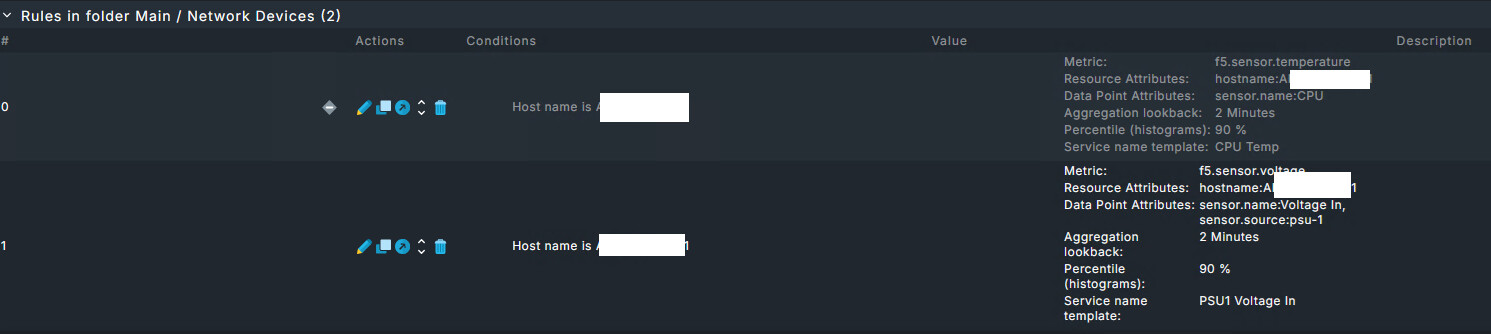
If I have what I need for alerting, I use the small icon next to the delete icon to create a rule which creates a service.
I only go down the DCD route Mattias mentioned to get RED metrics. But that is typically only possible, if the service is instrumented via OpenTelemetry
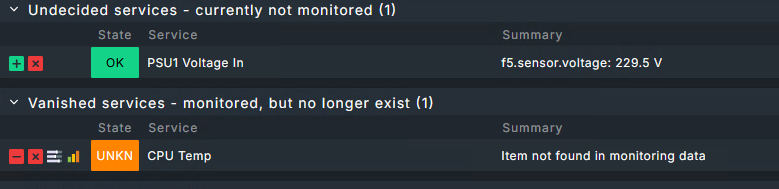
Ok I am getting somewhere now, the problem was my F5s were not sending hostname through properly, but we were able to set a custom attribute in their exporter config. Now thats coming through so I can filter between them.
 to create a rule which creates a service.