Hi, I just installed the server on Docker. It runs well, but when I login, I only see the typical: “As soon as you add your Checkmk server to the monitoring, a graph showing the history of your host problems will appear here. Please also be aware that you might see this message might appear as a result of a filtered dashboard. This dashlet currently only supports filtering for sites. Please refer to the [Checkmk user guide] (Dashboards) for more details.”
Well, when I had it on my Ubuntu machine, I just installed the agent, and it will populate.
How does it work as a Docker container?
Then the only thing left to check is, if the host and container have the very same name.
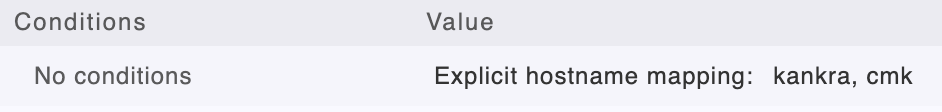
If that is not the case, you need a rule “Hostname translation for piggybacked hosts” to map container name and host. Only if those two names align can the piggyback mechanism work.
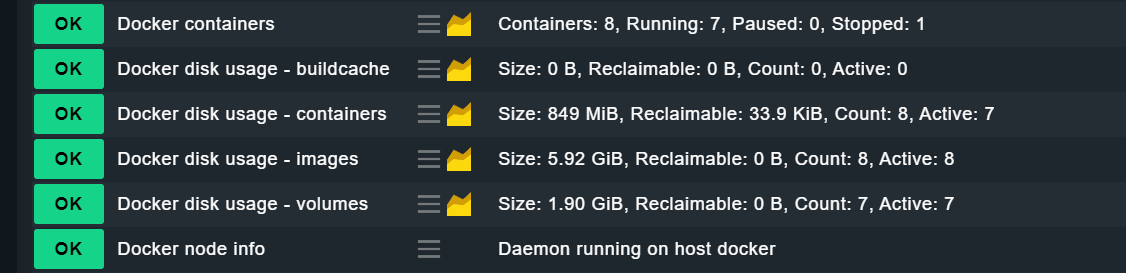
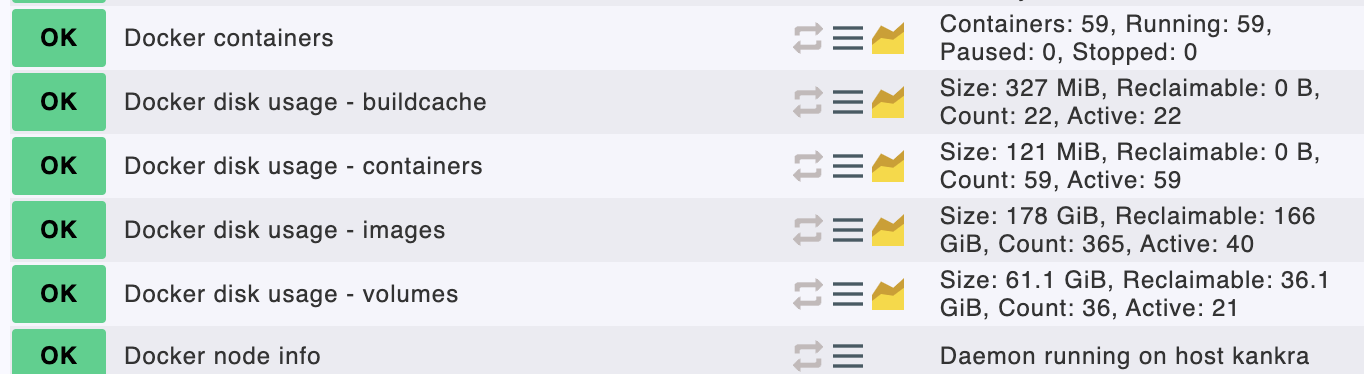
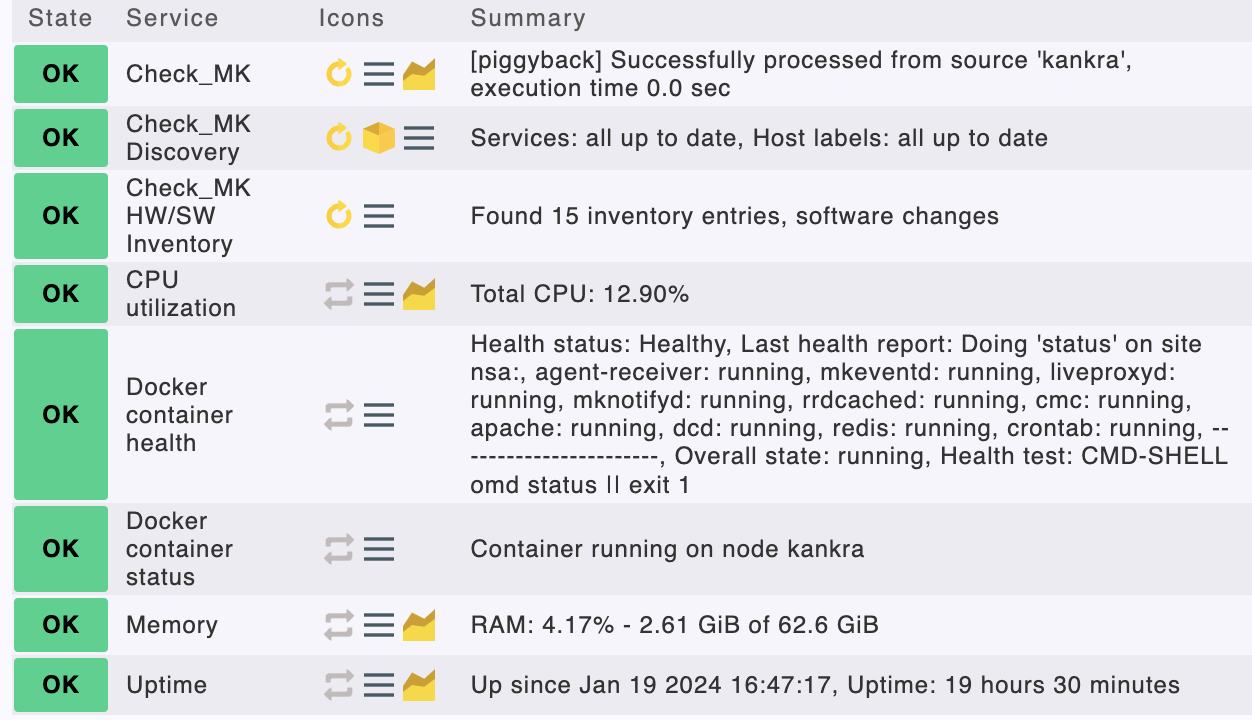
Hello, I have installed the docker plugin on my host (name: kankra). This works fine, with the help of the dynamic host management I see allmy docker containers, including my CheckMK container (name: cmk). I have created a piggyback name mapping rule that maps kankra to cmk but the error in the main dashboard page still exists: “As soon as you add…”.
And therefore no graphs are shown.
What is wrong with this setup?
Best regards
Hi Robin,
I solved the problem. I just added a host object with IP 127.0.0.1 to the monitoring. Now all the CheckMK specific services are shown within this host, in addition the default main dashboard is now populated with graphs. The drawback: There are some duplicated services like hard disks, which are now monitored within this host (reflecting the hard disks of the docker host), and the docker host itself, which is monitored by it’s real IP address. But this is just a question of disabling some or all of these services.
Thanks for your assistance.
Best regards
This topic was automatically closed 365 days after the last reply. New replies are no longer allowed. Contact an admin if you think this should be re-opened.