We upgraded one of our RAW check_mk installations today to version 2.0.
Since then we have been receiving (null) in the summery of the Check_MK service on random hosts at random times.
This happens on all sorts of hosts as well (SMNP,Windows Agent,Linux Agent)
Has anyone else encountered this? is there a solution for this issue? Known bug maybe?
Thanks for responding. Oddly enough the issue seems to have been resolved by itself.
hasn’t happened in the past 13 hours+. When it used to happen every 30 minutes.
The only other 2 issues I’ve noticed since the upgrade is my livestatus usage on the analyze configuration page is at 100% all the time. and I’m using the maximum amount of parallel livestatus connections (20). is there any way to increase this? the documentation points to a page on the global settings that does not exist.
Also several ESXI hosts seem to be reporting (Service Check Timed Out) on the Check_MK Service.
but I have yet to properly diagnose if this is a false positive or not.
For this i would recommend to do a “cmk -D hostname” on the command line, not that something with the configuration is wrong for this host. Old hosttags or something like this.
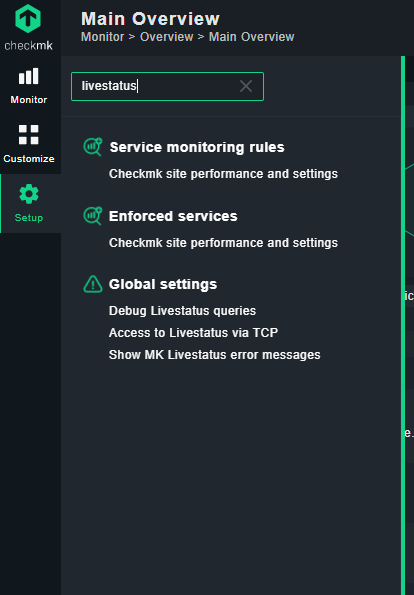
The config setting is “Maximum concurrent Livestatus connections”. On my system it is shown if i search for livestatus inside the setup.
Thanks for responding.
Regarding the ESXI host. I don’t see anything wrong with the configuration. ill try removing and re-adding it maybe and see if that helps.
Alternatively is there any way I can make it so this alert does not appear? as long as its not a hard down and pings aren’t being lost. I don’t really want to see an event for it.
Regarding the Maximum concurrent Livestatus connections. this setting does not exist for me in the raw version of 2.0.
For the RAW edition you can edit the Nagios livestatus broker module configuration.
Inside “~/etc/mk-livestatus/nagios.cfg” you can find the “num_client_threads” this is the same what you can configure on the enterprise with the web settings.
Thanks! That worked. I tried increasing it to 80 but once I restarted check_mk it went straight up to 80 and 100%
Is there any log I can check to see what’s causing the problem? as I assume I shouldn’t increase it more : P
80 concurrent connections is very high. How big is the system?
You can look at the “web.log” and also at the Nagios core log.
But i think it could be a problem with some web extensions inside your installation.
Not that big. 200 hosts 6000 services.
I just increased it from 20 to 80 just to see if it solved anything. it didn’t : P
I looked at the web.log and didn’t see anything noteworthy nor on the nagios.log file
I also tried removing all of my MKP extensions.
Is there another log file I’m missing or a method to debugging livestatus queries in the raw edition?
What we found most times, if such a problem exists, there was somewhere an open browser with the old interface loaded that was not completely reloaded after the upgrade
This is also happening to me in a fresh 2.0.0p7 raw edition install, just monitoring tree hosts: one the own cmk host system with Rocky linux 8.4, and two environment sensors through SNMP.
Hi everyone,
I’m also having this problem with the clients randomly reporting a summary as (null).
I have tried increasing the number of client threads from 20 to 60 (1100+ clients) but it seems didn’t make a big difference. With version 1.6.0p24 it was set to 20 and never had this (null) issue.
I also noticed, could be just coincidence, that every time I apply a change, new alerts with summary (null) appear on the dashboard.
I just migrated recently from 1.6.0p24 RAW to Check MK RAW 2.0.0p8.
Any idea what it could be or where to look for messages/errors?
Many thanks!
Hi,
Thank you for replying, although this doesn’t seem to be my issue.
All my SNMP connections are working fine having the right credentials.
This problem happens with servers having the agent installed mostly, and it seems to be triggered when I click “apply changes”.
It looks like the ongoing connections to the agents are cut when applying new changes and instead of being discarded are listed as “null” because they were interrupted, this is just a guess though, couldn’t get to the bottom of it.
Thanks for the info anyway
Regards.
Hi, i have the same issue,
when apply any change configuration, random hosts return Service Check_mk with (null) state on Summary . I have increased num_client_threads, but the problem continues.
OMD - Open Monitoring Distribution Version 2.0.0p8.cre
Description: Ubuntu 20.04.3 LTS
I reported this issue as soon as first stable version of 2.0 was released. I never received any kind of answer to this report. In current check_mk RAW version (2.0.0p15) the issue still exists. It seems that check_mk guys are not interested to release stable free version which can be used to monitor infrastructure with more than 30-40 hosts. In other words, if you have to monitor infrastructure with more than 30-40 hosts (and you don’t want to use an alternative), you have two options: