Error message:
Snapshot with a creation time in future found. Please check your network time synchronisation. This happens on the vCenter and on the individual VMs.
Output of “cmk --debug -vvn hostname”: (If it is a problem with checks or plugins)
VM is off, so I’m only including part of the output to make the post a bit more readable. The same happens on all VMs.
Received no piggyback data
CPU load             PEND Check plug-in received no monitoring data
CPU utilization      PEND Check plug-in received no monitoring data
Check_MK Agent       PEND Check plug-in received no monitoring data
Disk IO SUMMARY      PEND Check plug-in received no monitoring data
ESX CPU              demand is 0.000 Ghz, 4 virtual CPUs
ESX Datastores       Stored on ESXi_Storage (5.45 TiB/47.1% free)
ESX Hostsystem       Running on ESXi_IP
ESX Memory           VM is poweredOff, skipping this check
ESX Mounted Devices  HA functionality guaranteed
ESX Name             VM_Name
**ESX Snapshots        Snapshot with a creation time in future found. Please check your network time synchronisation**.
Filesystem /         PEND Check plug-in received no monitoring data
Filesystem /boot/efi PEND Check plug-in received no monitoring data
Interface 2          PEND Check plug-in received no monitoring data
Kernel Performance   PEND Check plug-in received no monitoring data
Memory               PEND Check plug-in received no monitoring data
Mount options of /   PEND Check plug-in received no monitoring data
Mount options of /boot/efi PEND Check plug-in received no monitoring data
Number of threads    PEND Check plug-in received no monitoring data
Systemd Service Summary PEND Check plug-in received no monitoring data
Systemd Socket Summary PEND Check plug-in received no monitoring data
Systemd Timesyncd Time PEND Check plug-in received no monitoring data
TCP Connections      PEND Check plug-in received no monitoring data
Uptime               PEND Check plug-in received no monitoring data
I’ve had this issue since upgrading to 2.3.0p3, at least as far as I remember, this is very recent and never happened before. My timezone is set correctly on the vCenter, ESXi hosts, CheckMK’s Ubuntu and all times, when verified, match.
They also all use the same NTP server. Is there something I’m forgetting to check?
Took me a bit of time to checkm, Monday was busy, but they all seem to be. CheckMK and vCenter allow a timezone to be set as America/Toronto. For ESXi, the only timezone is UTC, but the time matches and so do the timeservers.
Do you know if there’s a way to create a snapshot, then run a check but with a bit more details than “Snapshot with a creation time in future found. Please check your network time synchronisation”? I’ll look through the docs but I’m not used to Checkmk’s commands, don’t need them often.
It has the same feel as a website saying “Please check your internet connection” as I’m downloading 200gb worth of files
I am having this same issue as soon as I went to 2.3.0. Been running the enterprise version for many years with no future snapshot alarms. I have also gone through all of our systems. We have our own gps clock and all of the systems in question are synchronized. We verified the vSphere box, the CheckMK box, and the VM’s getting the warnings are synchronized and still having the issue.
The other peice of this puzzle is the device actually doing all the snapshots which is our backup appliance. We use Datto BCDR @dono2020 I’m not sure if you are using the same company or if your snapshots are being triggered by a device using the vmware api to do backups via snapshots.
We actually use Veeam Backups, but it doesn’t seem related since creating Snapshots on the vcenter host manually or on the ESXi servers give us the same issue, it’s confusing, at least I know I’m not alone.
I just upgraded one of our CheckMK sites to version 2.3.0p4 (raw edition) and I am now seeing this exact same error on my dashboard. I’d never seen the alert on version 2.2.x. Only after upgrading do I now see it. I’m trying to delete some snapshots to see if that will at least clear the alert.
I’m only doing snapshots locally on the ESXi server. I took one just prior to upgrading the vm which runs CheckMK.
You can download the agent output from the vCenter through the UI (Check_MK service → hamburger menu → Download agent output), or run cmk -d $VCENTER on the site it is monitored on.
Then you can look at the data around the snapshots. Maybe that gives us an idea where to look at exactly.
That’s fair, forgot I could simply do that from the GUI. Here are bits relating to snapshots. The last bit confuses me a bit, I’m not sure if that’s normal formatting for the date since the time is right. If someone has an older CheckMK than 2.3, could be good to check.
snapshot.rootSnapshotList 162 1717612642 poweredOff VM Snapshot 6%252f5%252f2024, 10:37:17 AM
Otherwise I might spin up a quick one if I get the time
○ e2scrub_reap.service - Remove Stale Online ext4 Metadata Check Snapshots
 Loaded: loaded (/lib/systemd/system/e2scrub_reap.service; enabled; vendor preset: enabled)
 Active: inactive (dead) since Mon 2024-03-18 10:02:26 EDT; 2 months 18 days ago
 Docs: man:e2scrub_all(8)
 Main PID: 872 (code=exited, status=0/SUCCESS)
 CPU: 53ms
...
dmesg.service loaded inactive dead Save initial kernel messages after boot
dpkg-db-backup.service loaded inactive dead Daily dpkg database backup service
e2scrub_all.service loaded inactive dead Online ext4 Metadata Check for All Filesystems

e2scrub_reap.service loaded inactive dead Remove Stale Online ext4 Metadata Check Snapshots

emergency.service loaded inactive dead Emergency Shell
fstrim.service loaded inactive dead Discard unused blocks on filesystems from /etc/fstab
fwupd-refresh.service loaded inactive dead Refresh fwupd metadata and update motd
...
runtime.host ESXI_HOST_IP
runtime.powerState poweredOn

snapshot.rootSnapshotList 162 1717612642 poweredOff VM Snapshot 6%252f5%252f2024, 10:37:17 AM

summary.guest.hostName VM_name
summary.quickStats.balloonedMemory 0
Would you mind sending me a full agent output as a personal message @dono2020? Or open a support ticket, if you can. That might enable me to properly reproduce the issue.
You can convert the time from epoch with an epoch converter and take a look at the time the snapshot was created from the vCenter Client, maybe its a timezone conversion problem or something like that.
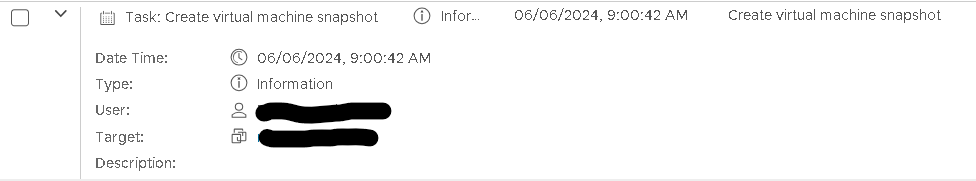
Your time zone:
Thursday, 6. June 2024 19:00:42 [GMT+02:00]
Just wondering since if your VCSA is configured with UTC, and that snapshot’s time “9:00:42am” does not match the epoch time “1717693242”, then it could help with finding the issue.
But other than that I definitely have no idea what the issue is, I just know it’s affecting enough people for this post to get some traction, so that’s a start
Same issue here. In our case, the Unix timestamp is 5 hours ahead of the actual time. We are at GMT-5, so definitely seems like a time zone conversion issue to me.