CMK version: 2.5.0p14 OS version: Ubuntu 24.04, running in docker container
Hello,
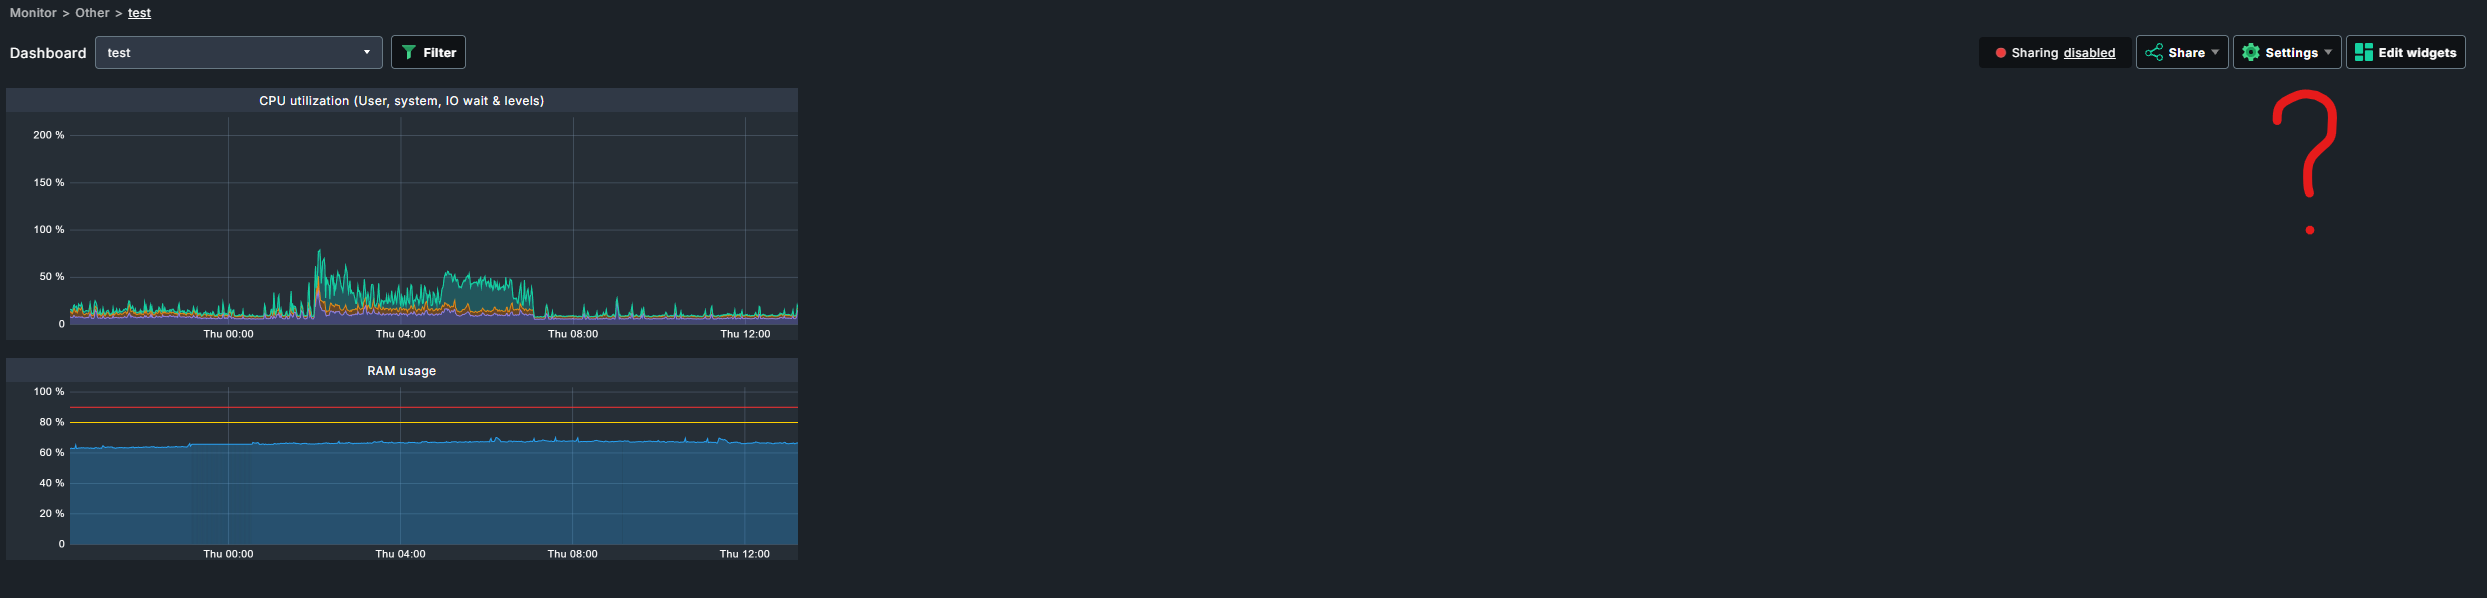
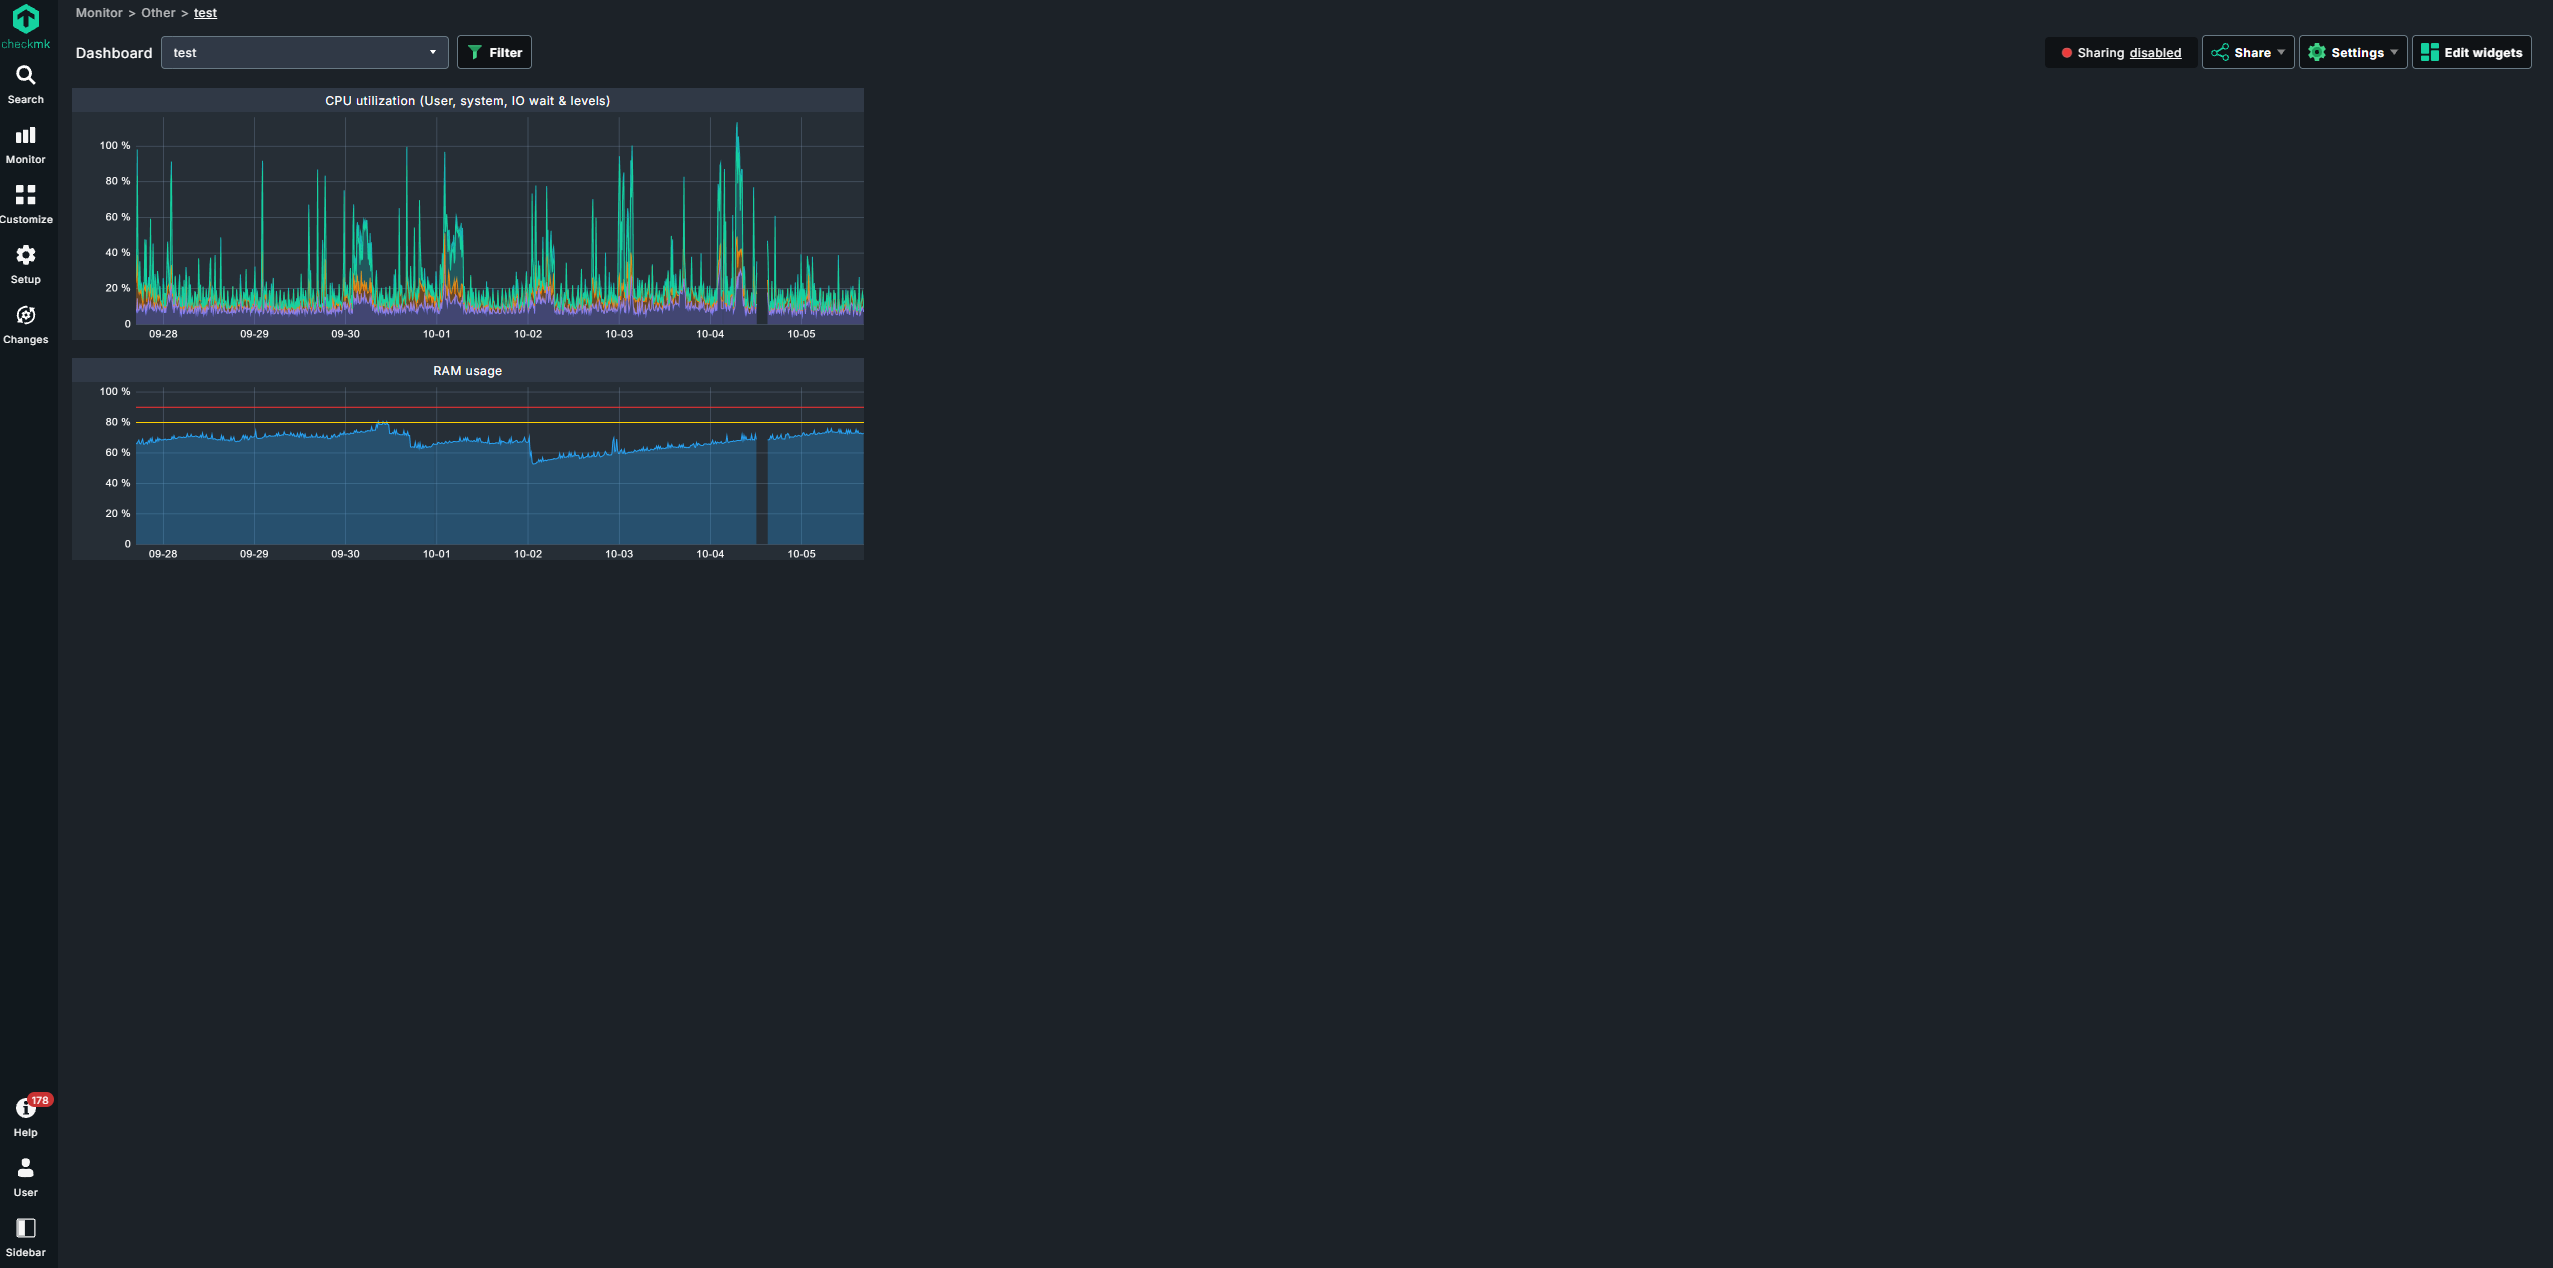
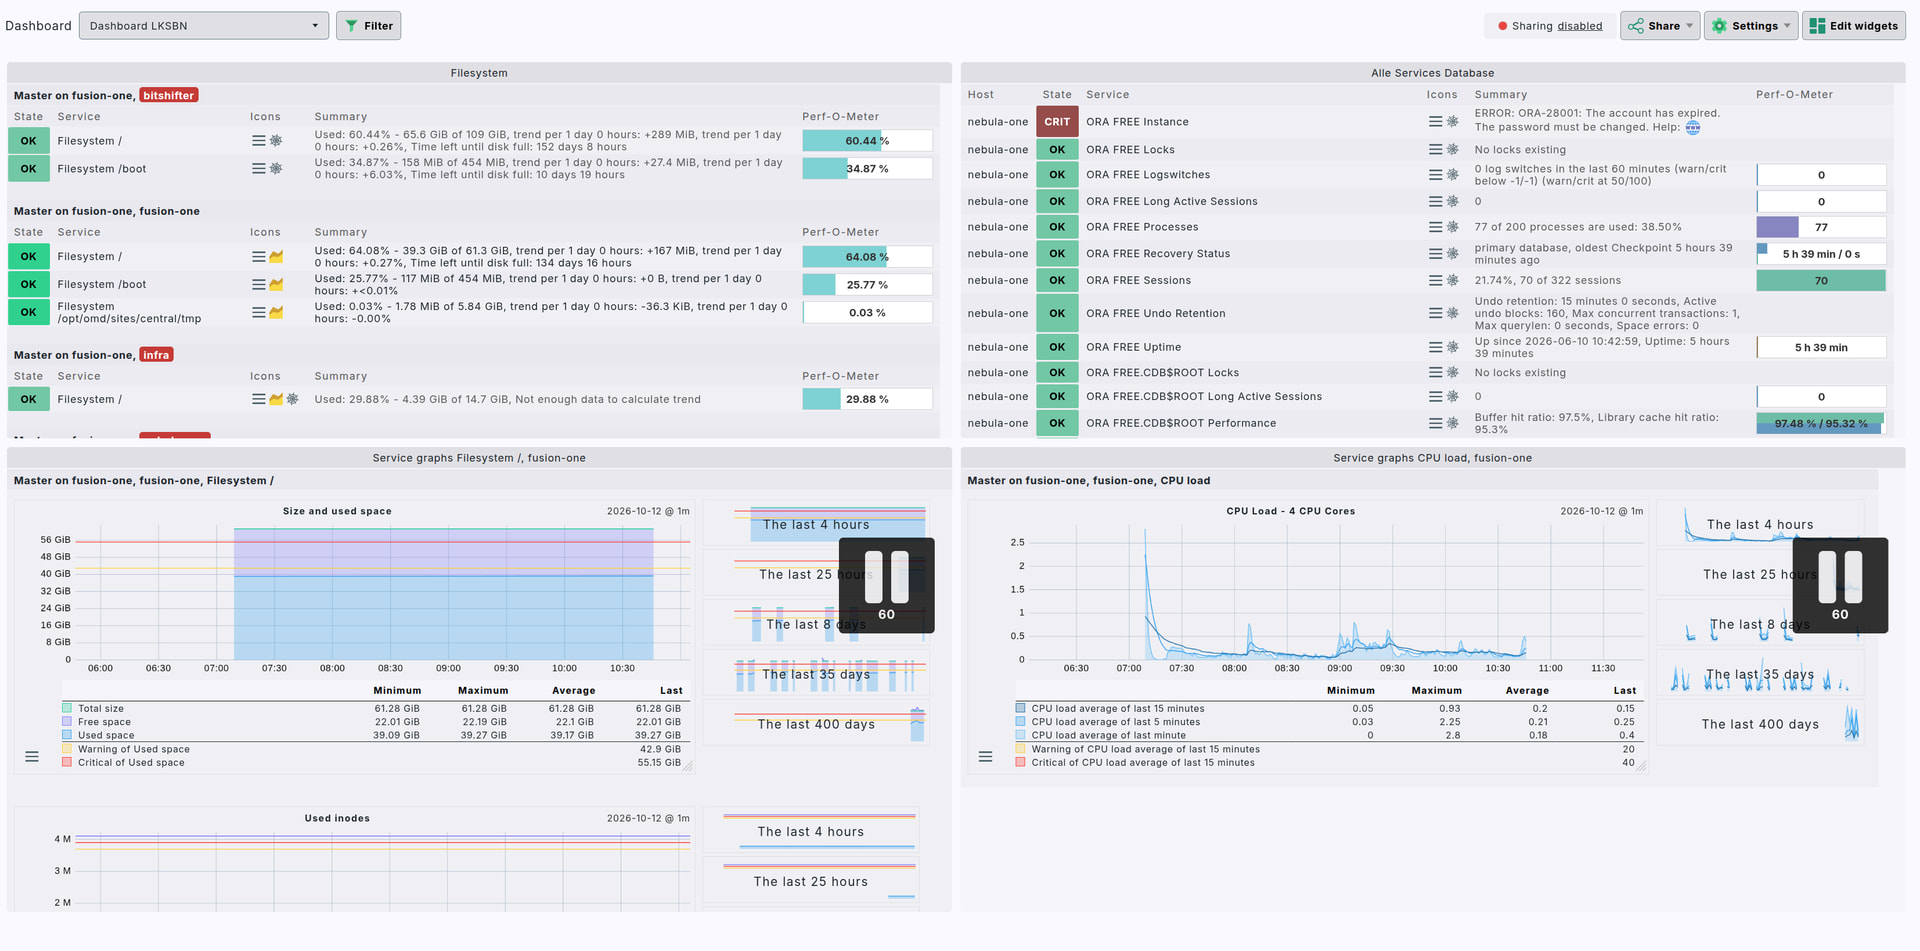
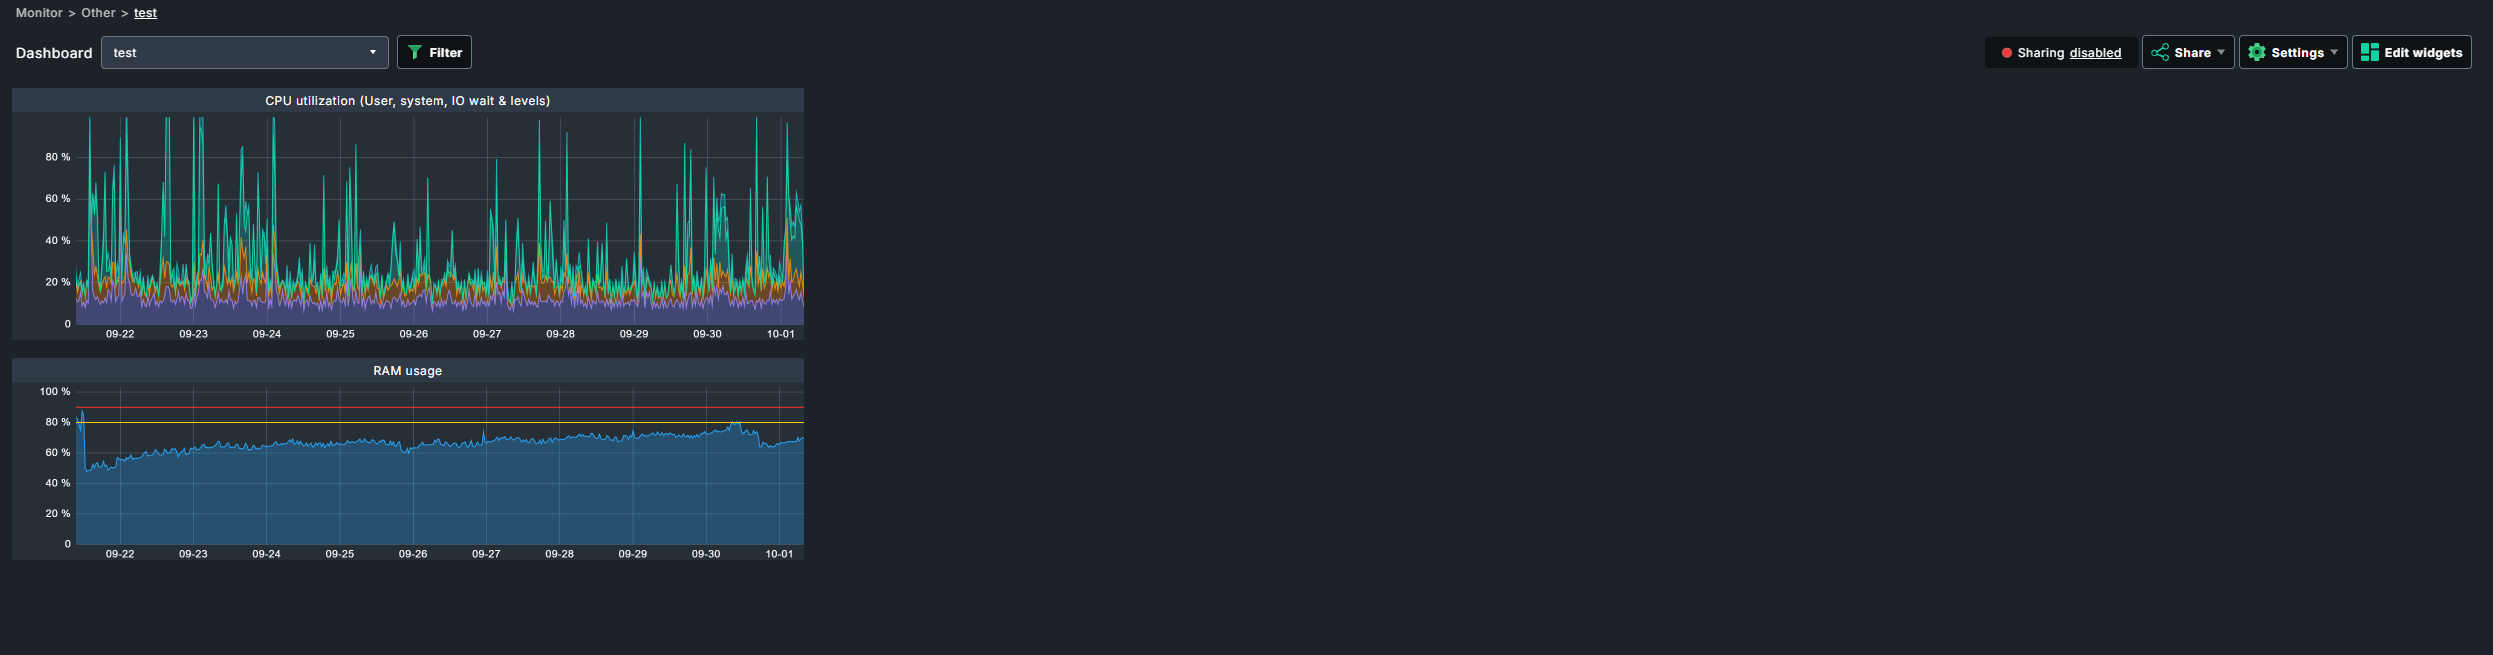
I have created a custom dashboard containing service graphs for several services.
To go back in time, I use the mouse wheel and drag from right to left to view the metrics over a more specific period.
However, after about thirty seconds, the time range displayed in all of my graphs resets to the most recent metrics (so I end up back at the far right of the graphs on my custom dashboard).
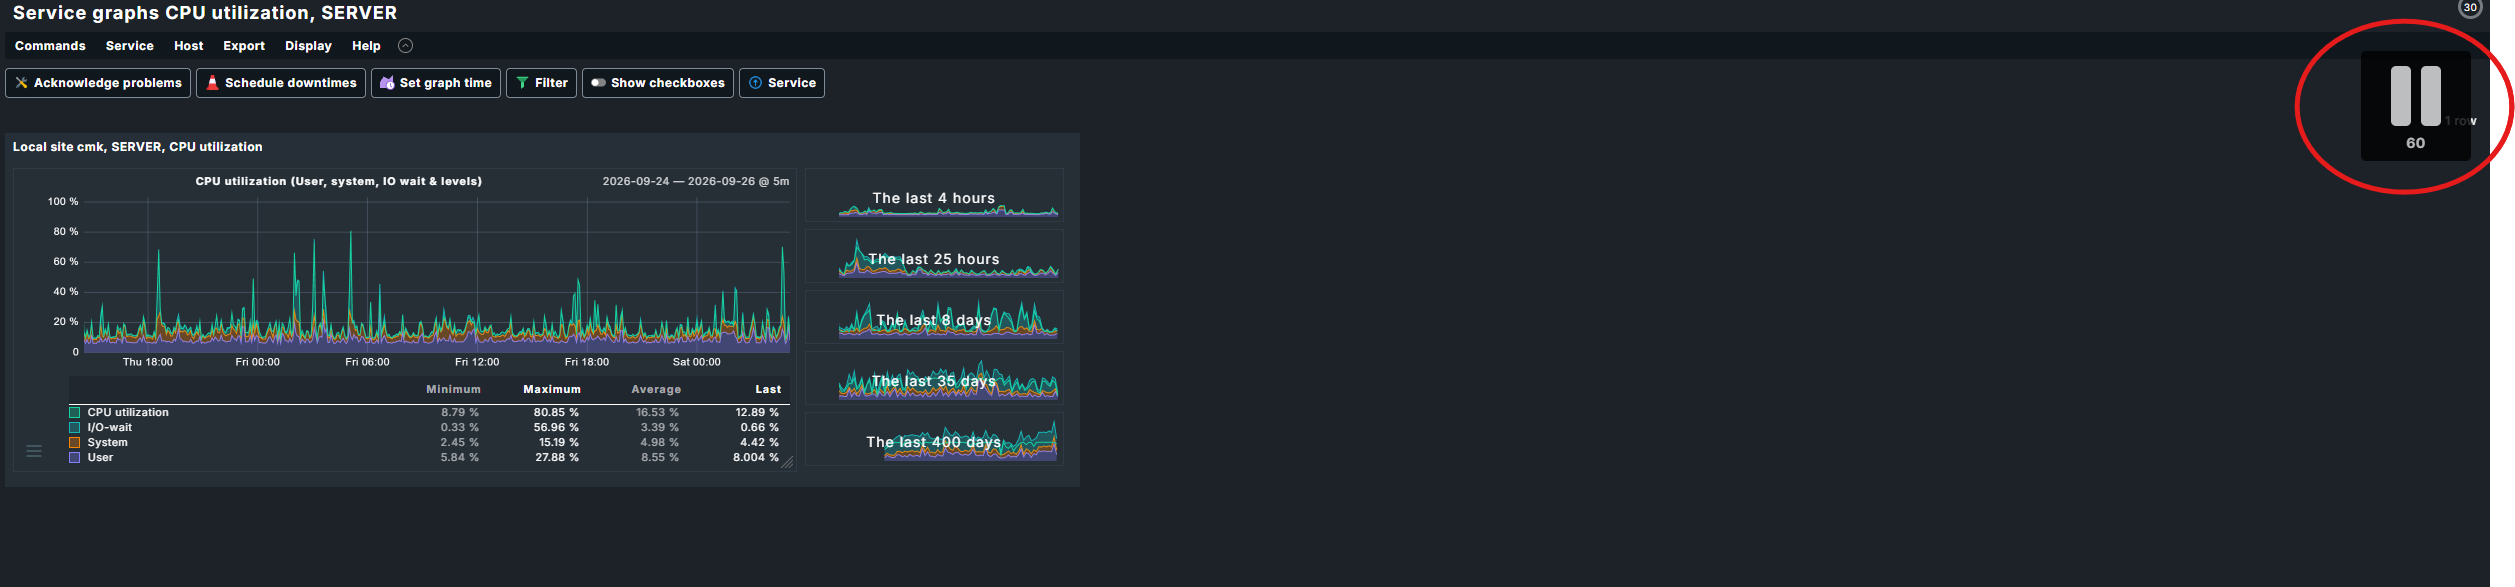
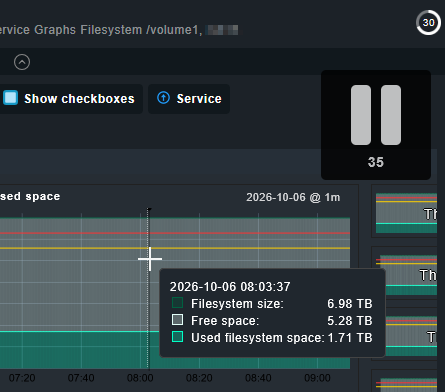
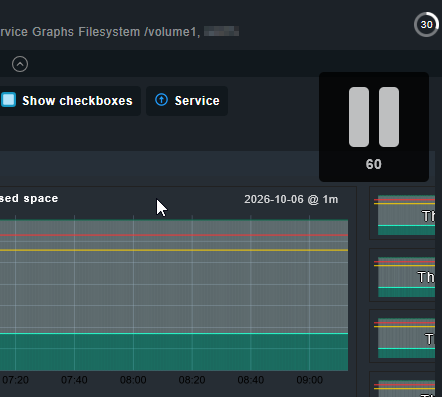
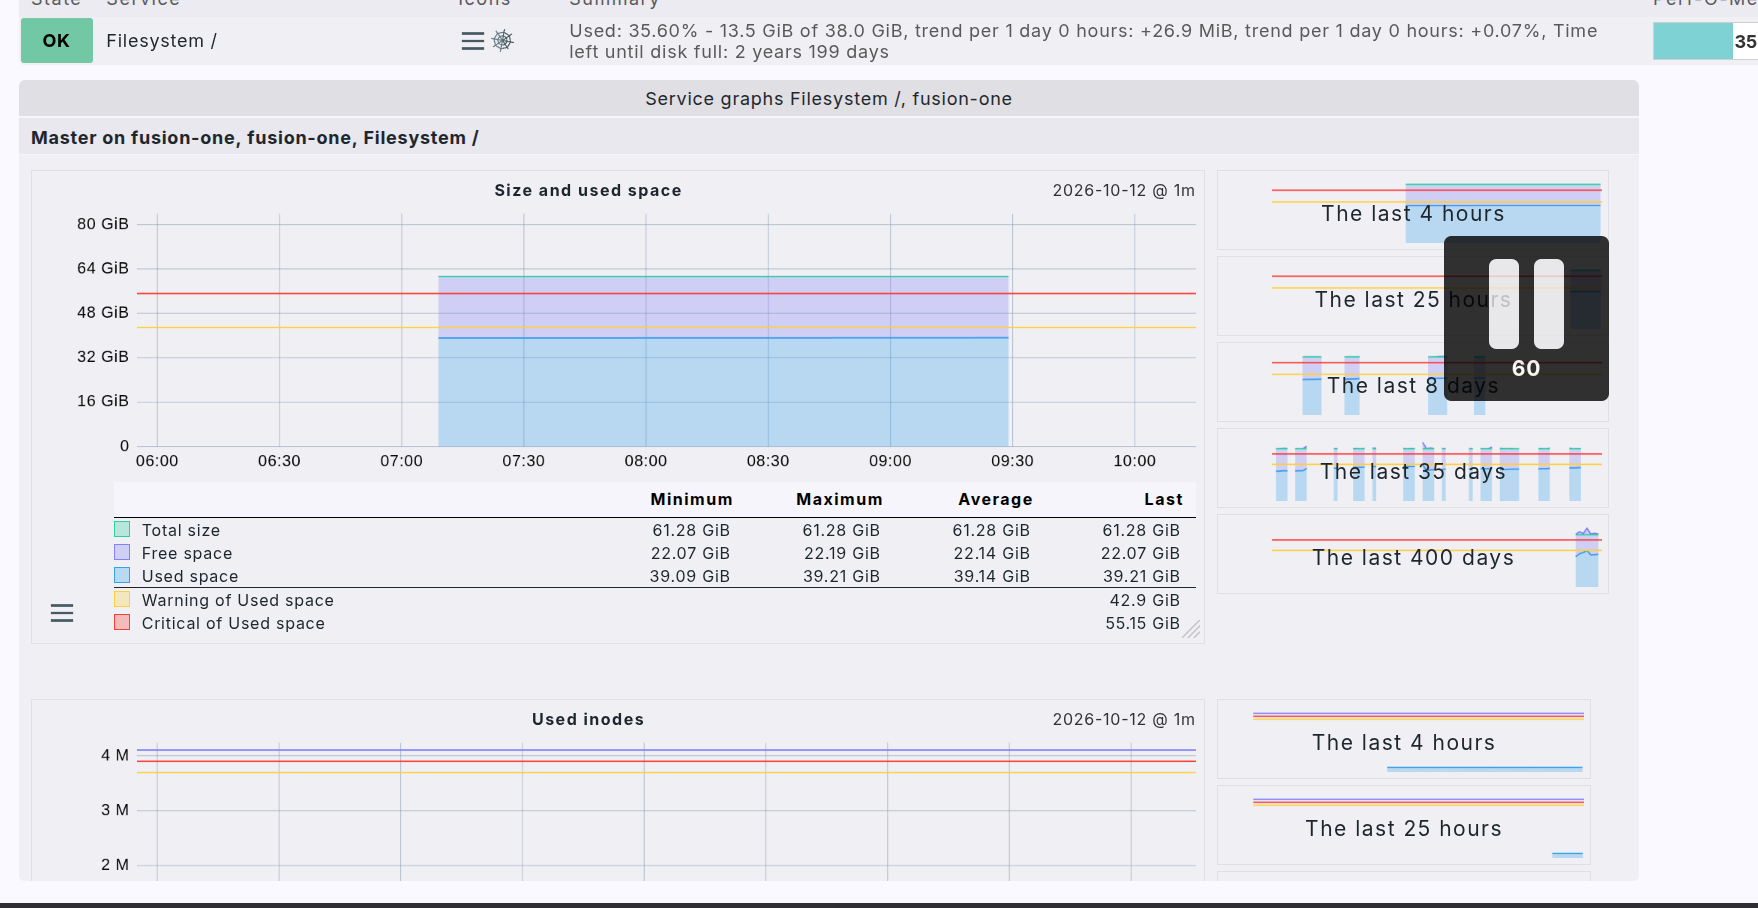
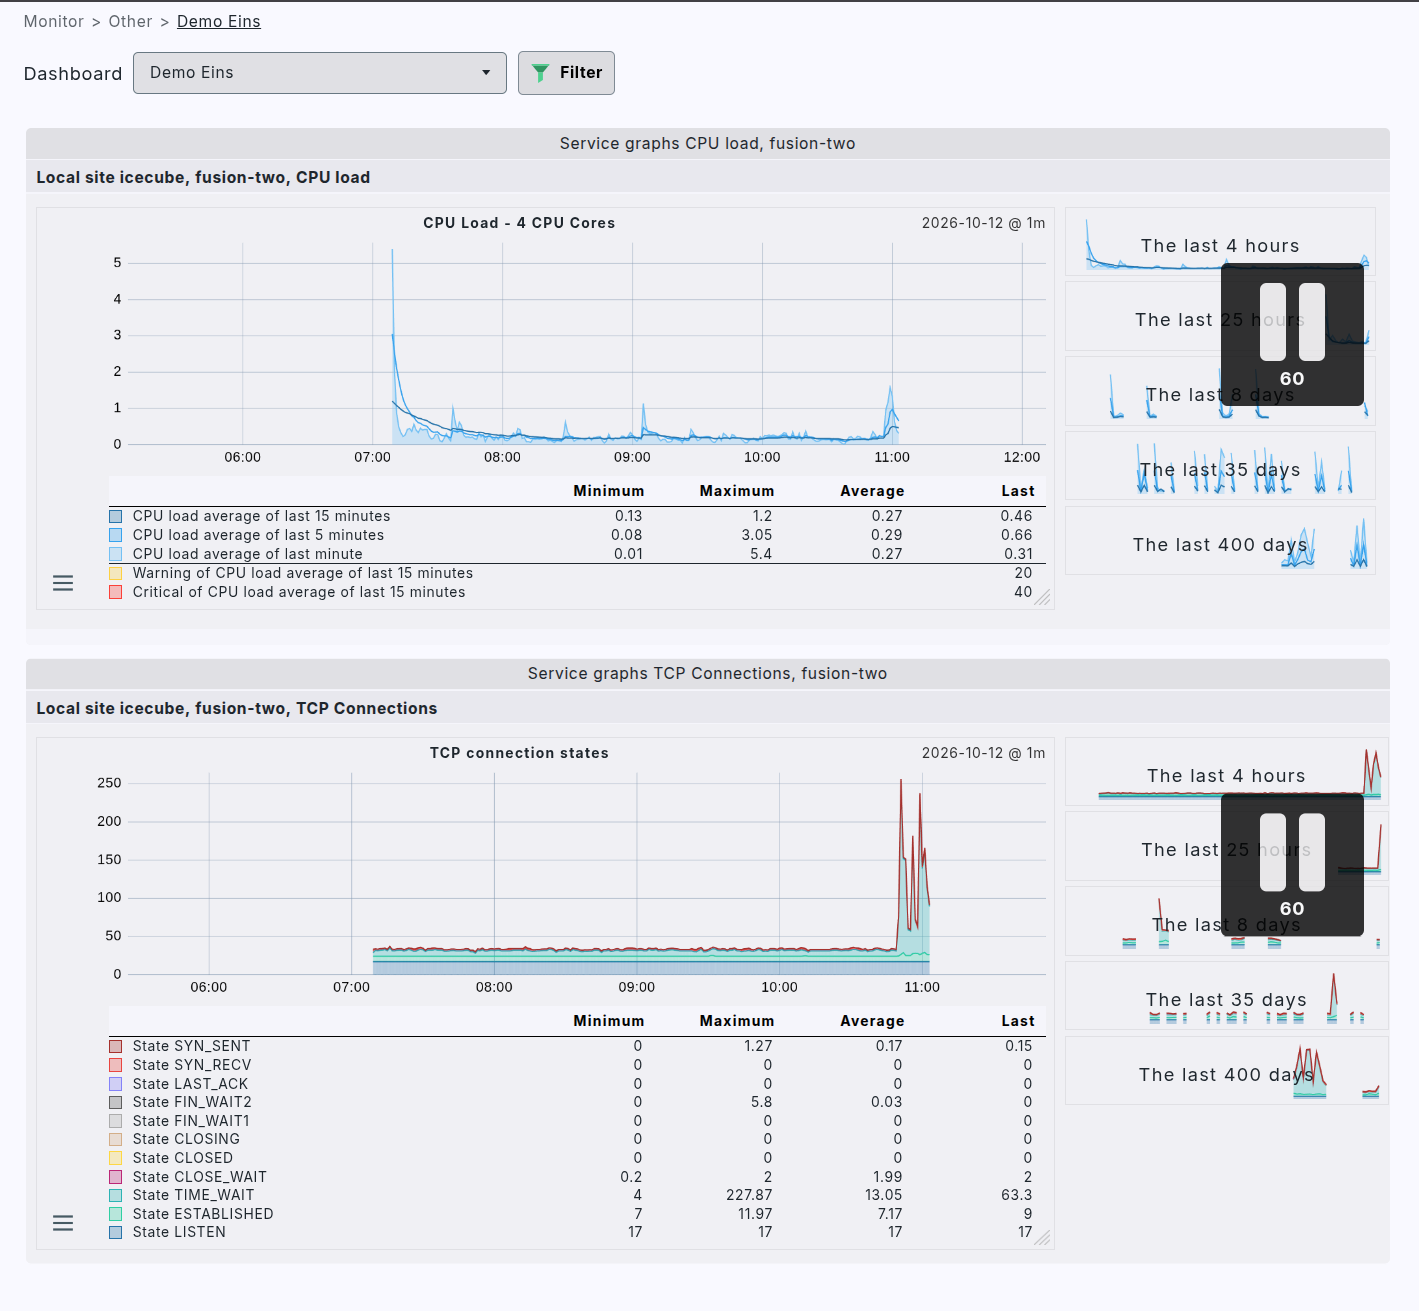
By way of comparison, when I open the graph of a service directly (not from my custom dashboard, but from the service itself), a small pause icon appears in the top right corner of my screen. Following the documentation, clicking on the number freezes the view, with no automatic refresh.
On my custom dashboard, this icon does not appear.
I am using Checkmk Community edition, version 2.5.0p19.
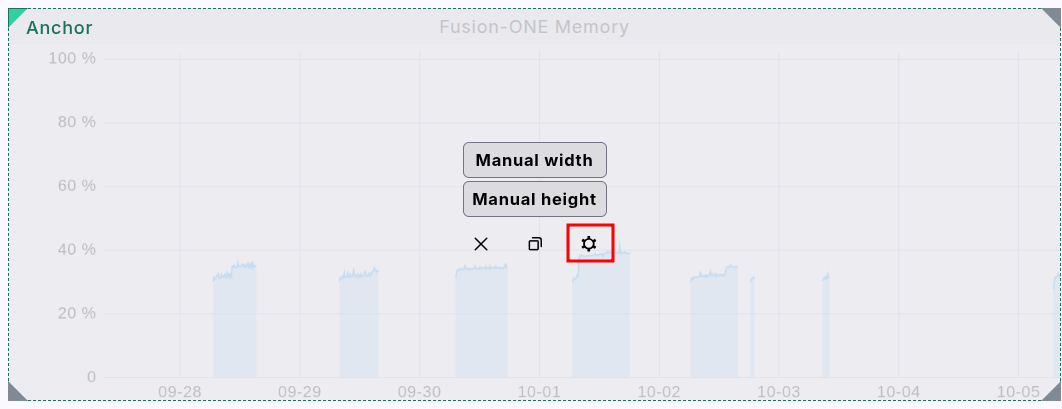
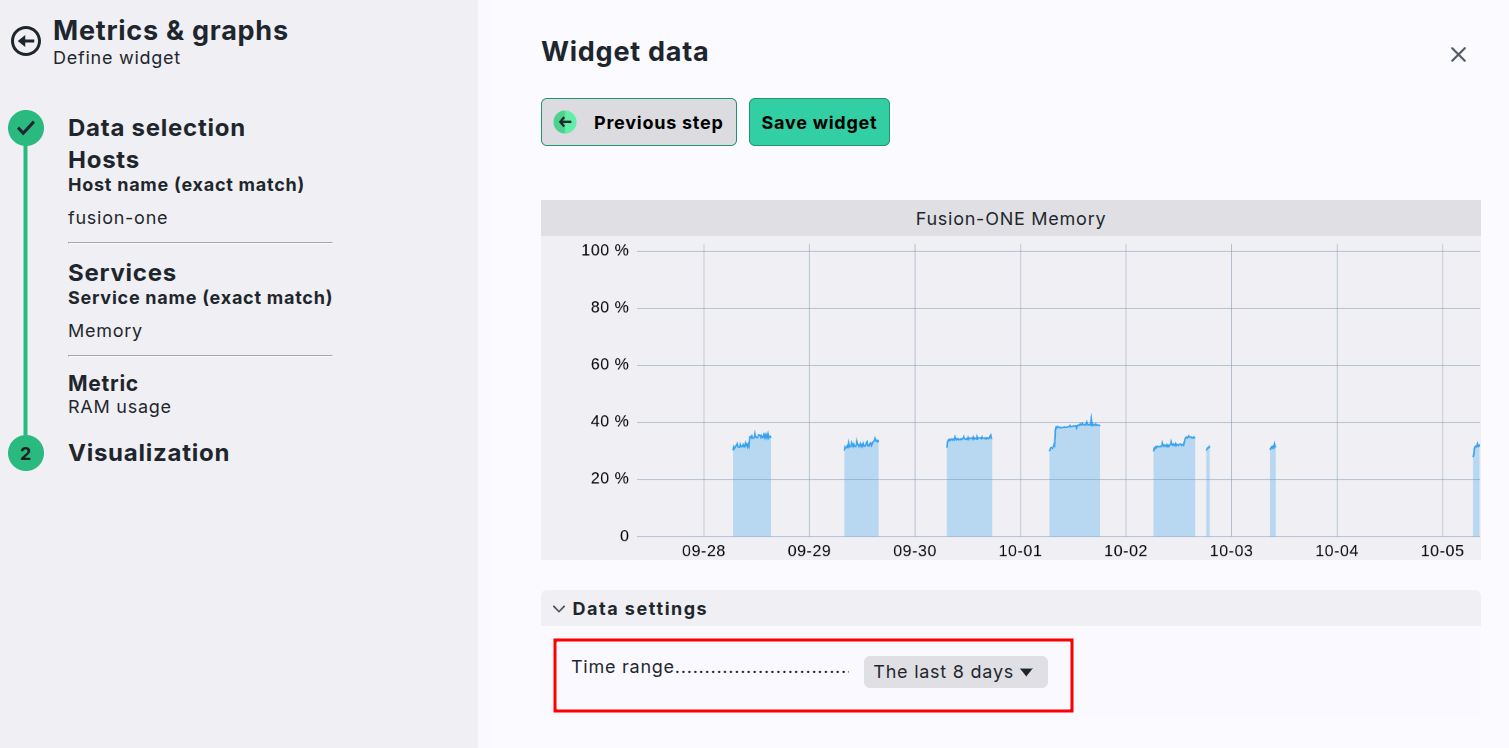
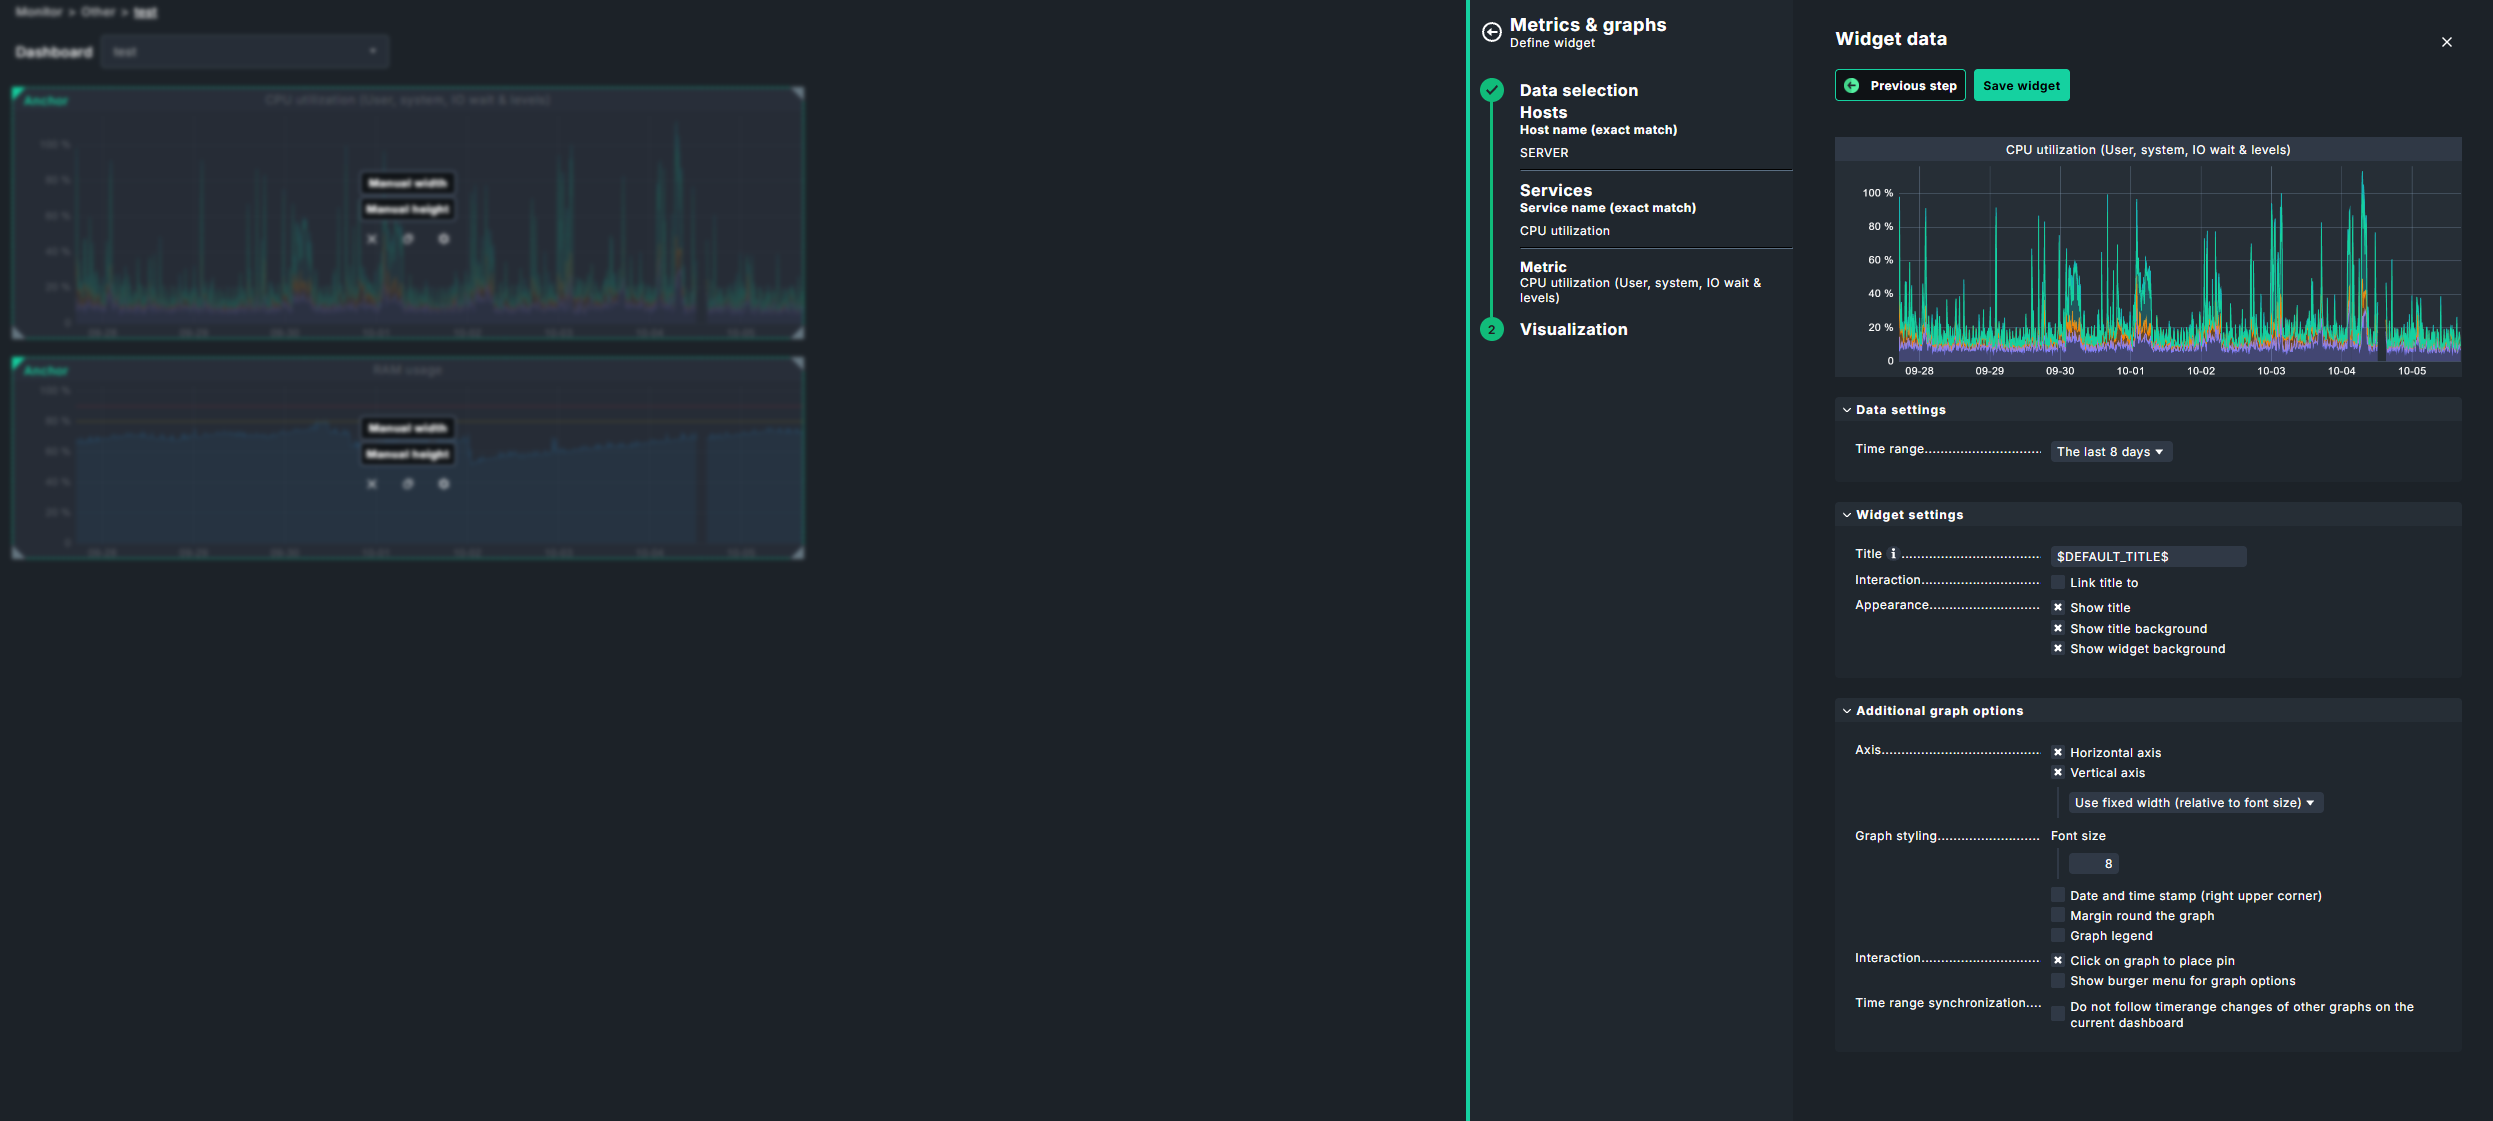
What you might would like to do is to setup the time range of the graph in the first place. Click on Edit widgets, then in the graph you should have a edit button as well, here a slide in appears where you can setup the time range.
Thanks for your reply. Setting a fixed time range in the widget works for a static view, but my use case is different: I want to browse back in time interactively (to investigate an incident, for example), and the dashboard refresh resets all graphs to the latest data after about 30 seconds.
On a single service graph page I can pause the refresh with the icon in the top right corner, but there is no such option on a custom dashboard. I know that in version 2.4 the pause icon was displayed on custom dashboards as well, so this looks like a regression in 2.5.
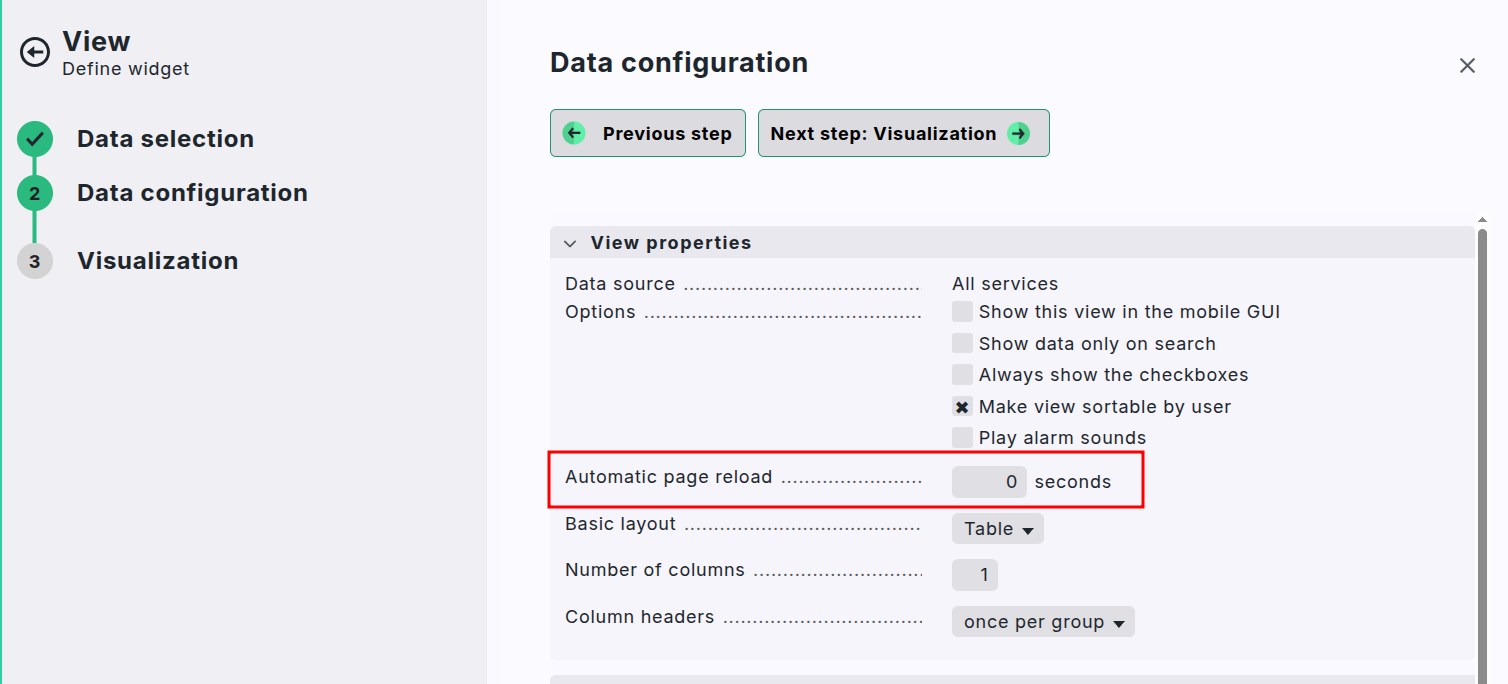
Is there a way to disable or pause the automatic refresh on a dashboard in 2.5, or is this a known bug?
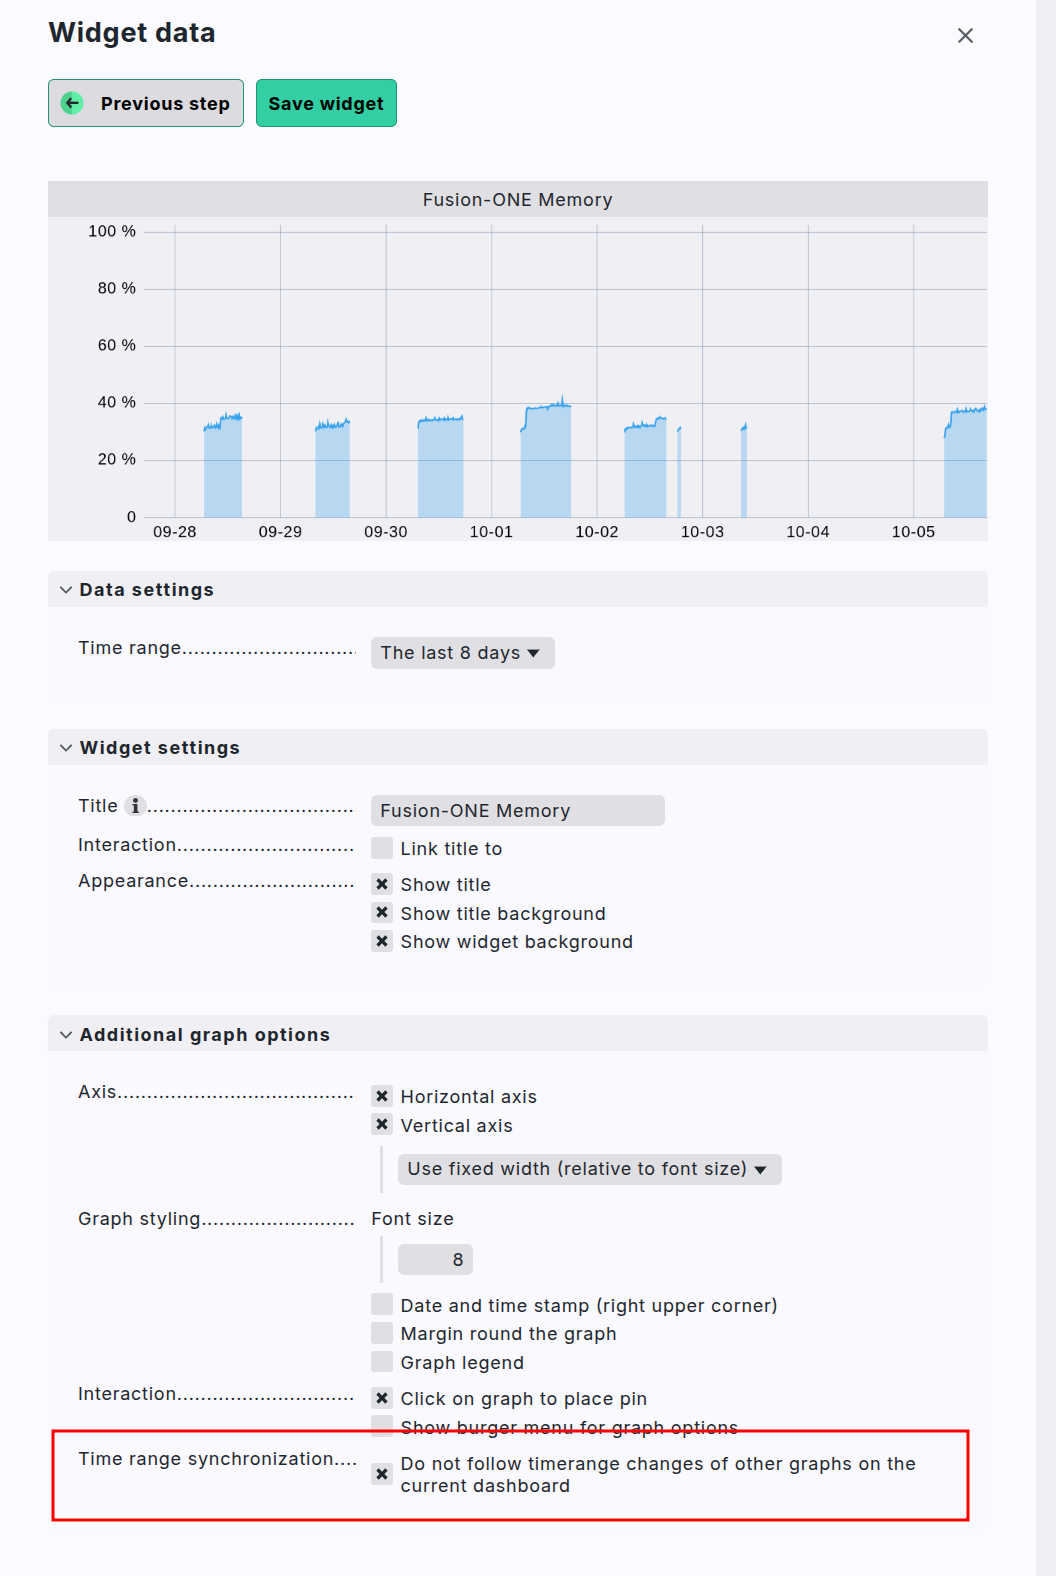
Even if that option were available, it would only be a workaround, for two reasons:
I would have to change it on every single graph of my dashboard.
I don’t want to disable the automatic refresh permanently. I want the dashboard to keep refreshing in normal use, and only pause it temporarily while I zoom in on a specific period.
That is exactly how it worked in 2.4: the pause icon appeared on the custom dashboard as soon as I changed the time range, and I could resume the refresh afterwards. In 2.5 this is gone, so it really looks like a regression rather than a configuration issue.
If I afterwards click outside of the graph data, like here right of the graph header, the black date time line is removed, but the view remains paused.
I upgraded to p15 a few days ago already, but it doesn’t fix the issue.
Your screenshot shows a service graph opened from the service itself. My issue is on a custom dashboard where I add service graphs. There, the pause icon still doesn’t appear.
This is not a new problem in 2.4 and 2.3 it was the same with the only difference you got the pause icon also inside the dashboard without doing anything. Refresh happens in 2.3 and 2.4 latest 60 seconds after you changed anything. This should be the reason that it was removed from the 2.5 dashboard.
With the upcoming 3.0 version there is a specific option inside the dashboards (daily build checked) to stop the refresh for the whole dashboard or extra a reset zoom option inside the graphs.