**CMK version:Version: 2.2.0p22
**OS version:AlmaLinux 9.3
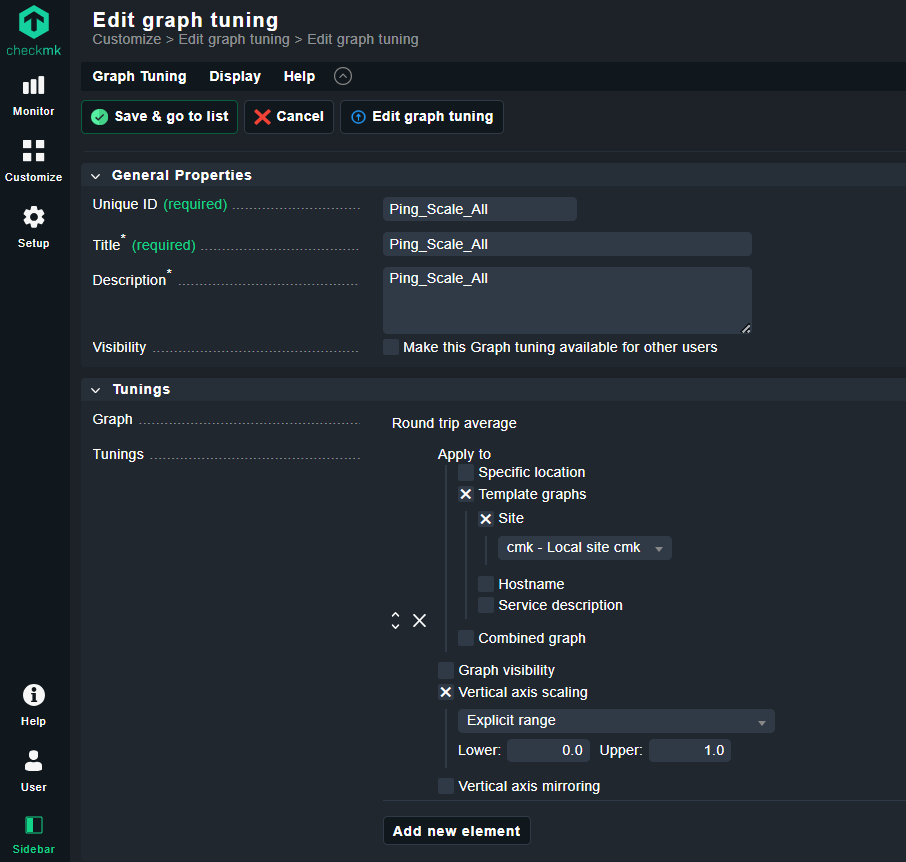
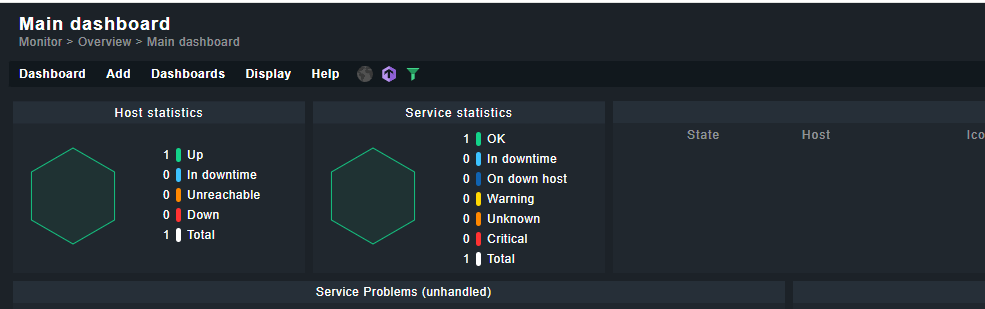
As my fist post I hope someone can assist and I am not breaking any community rules  I have attached the screenshots - It would seem that the custom scale (Graph tuning) is not allowing any value less than 1 (1000ms) as it needs to resolve as a float value.
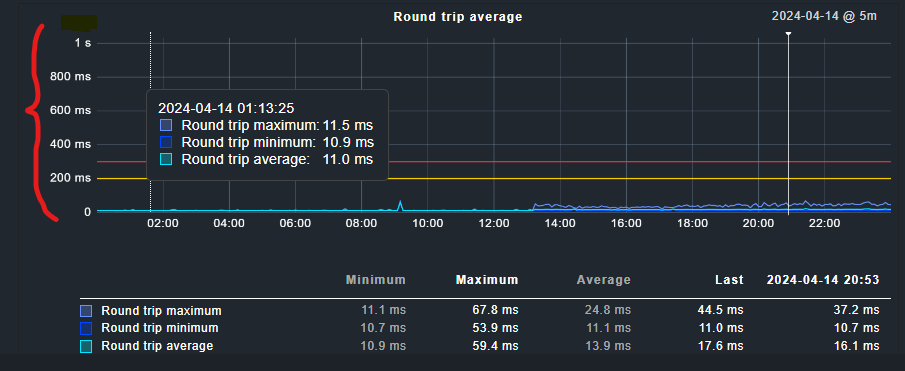
I do see various screenshots from other community members where the Round Trip Average scale is not fixed at 1 (1000ms). How do I get the deault view to be example 200ms to avoid scrolling the graph each time (and to be reported as such on images in reports etc.)
Eample picture of different scale can be seem in Edit ping rount trip times
Hi @john532
And welcome to the forum!
Thanks of being mindful of the community rules Unless you behave like a total jerk (or your average Stack Overflow user  ) you’ll be fine. This place is outright wholesome
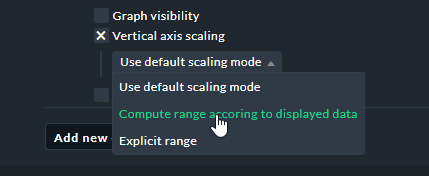
Now, to your question: What happens if you use one of the other options? My expectation would be that ‘Compute range according to displayed data’ should get you what you want.
Hi - Thank you for the response - Based on my understanding the expectation would be the same, but is remains at scal of 1000ms (1) even if i select the compute range (auto scale) option. Hence I attempted to force the scale to “overide” it, but no luck 
Perhaps worth noting if i increase the manual scale to 2.0 / 3.0 / 4.0 - this reflects accordingly (i.e. 2s, 3s, etc. but nothing smaller than 1 works.
Today I was playing around with the tuning once more, and I can seemingly only set whole numbers as values (i.e. -2, -1, 0, 1 ,2, etc.) This get interpreted as -2000ms (2s) , -1000ms (1s), 0ms, 1000ms (1s), etc.
Is there perhaps a config file somwhere to change the type of value? Also, why is this not default to accept intergers/values between 0 and 1.
Hoping to get a reponse soon. Really hard to view graphs in dashboard and emails with a big scale like this (when the value is 20-30ms but the graph scales to 1s minimum.)
Perhaps scaling incorrectly?
Hi @john532,
are you using the RAW edition of Checkmk? I ask because in my enterprise edition (2.2.0p24) the default (without tuning) is showing automatically scaled graphs for service and host perfdata.
I would have to check this in RAW if that’s your edition…
BR,
Marsellus W.
Hi again @john532 !
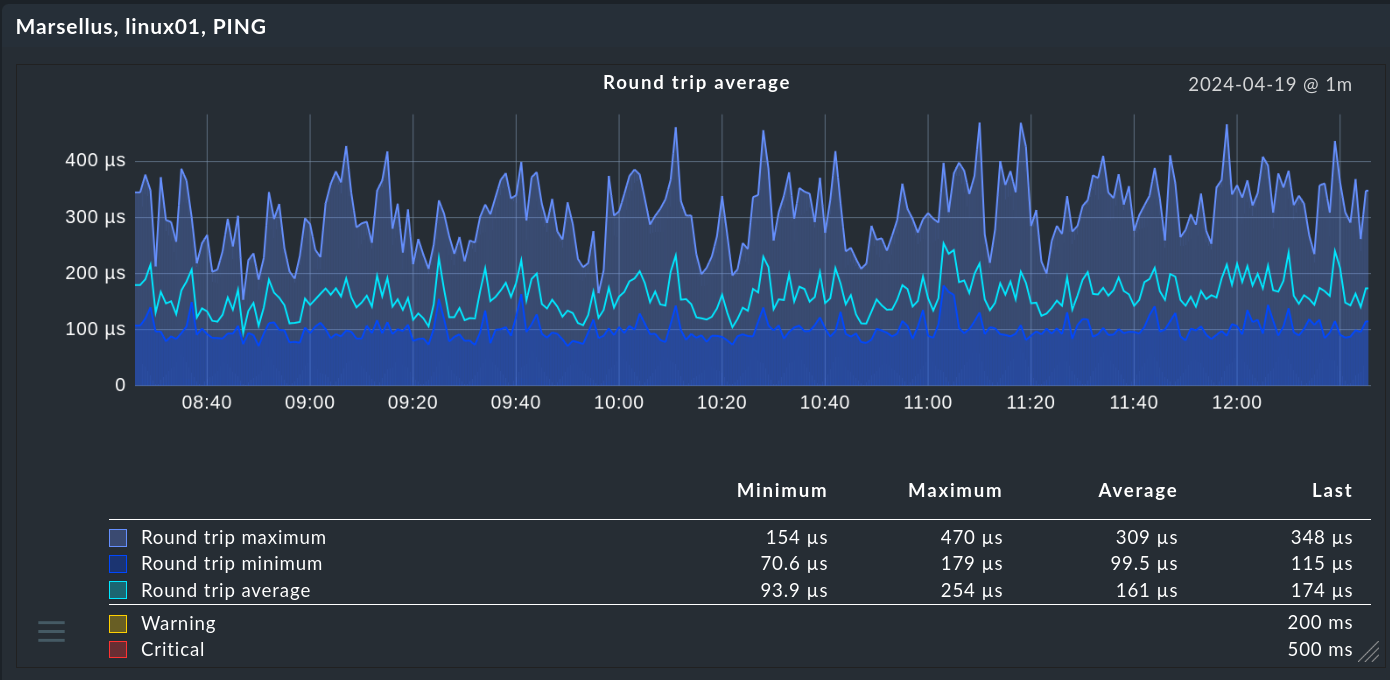
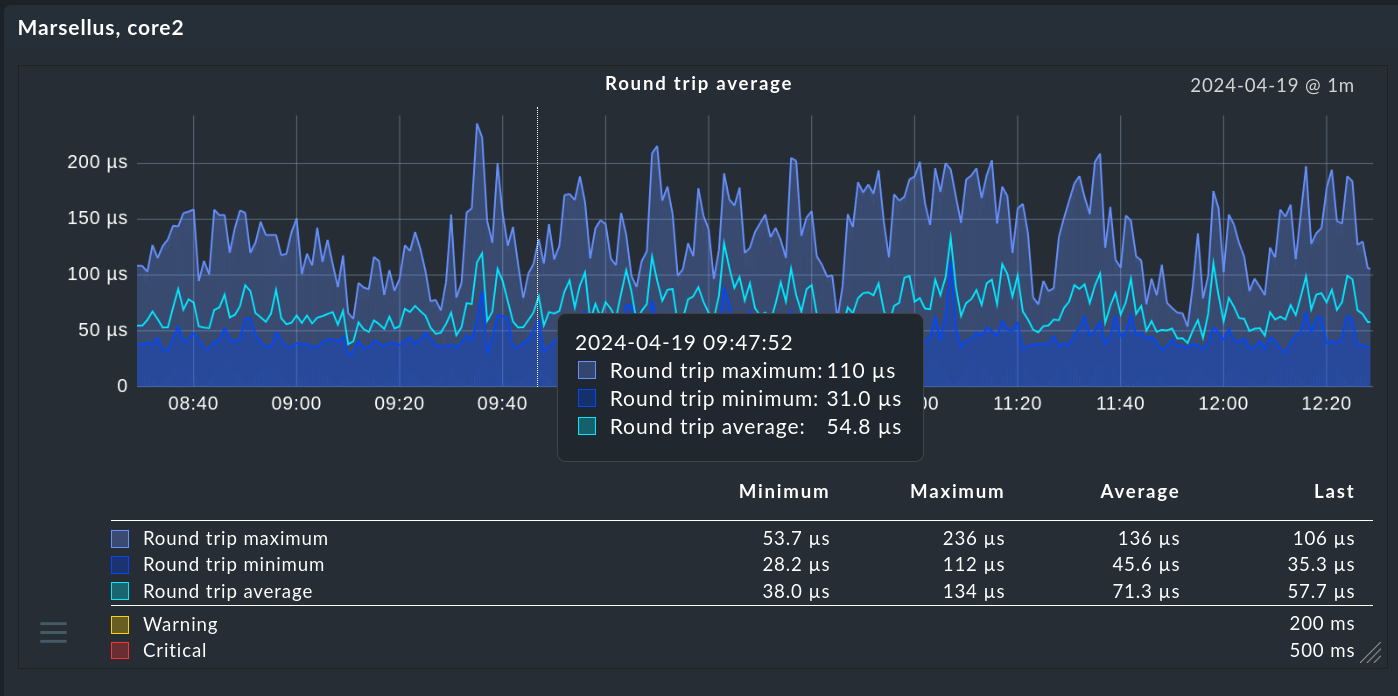
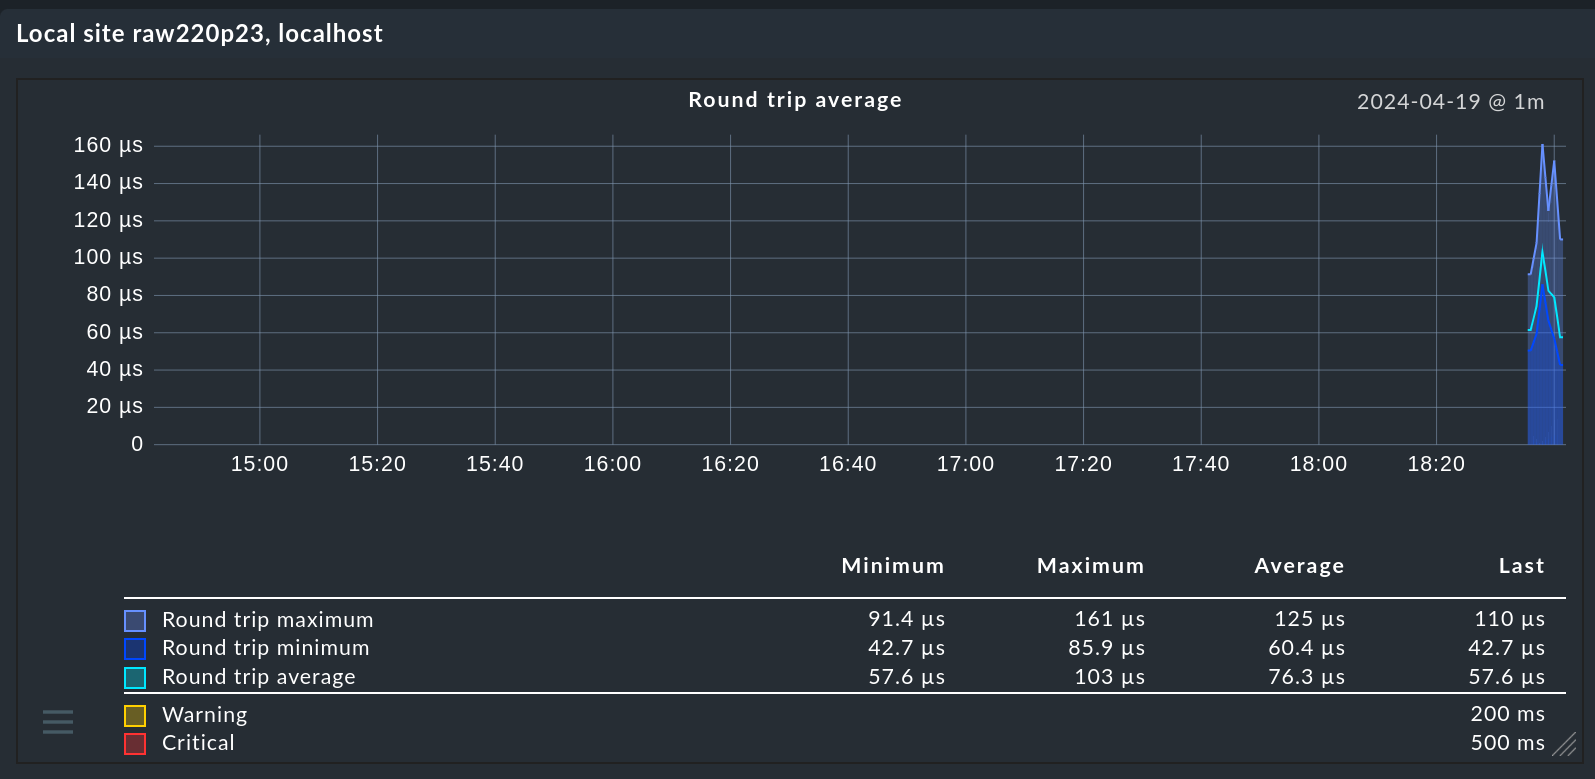
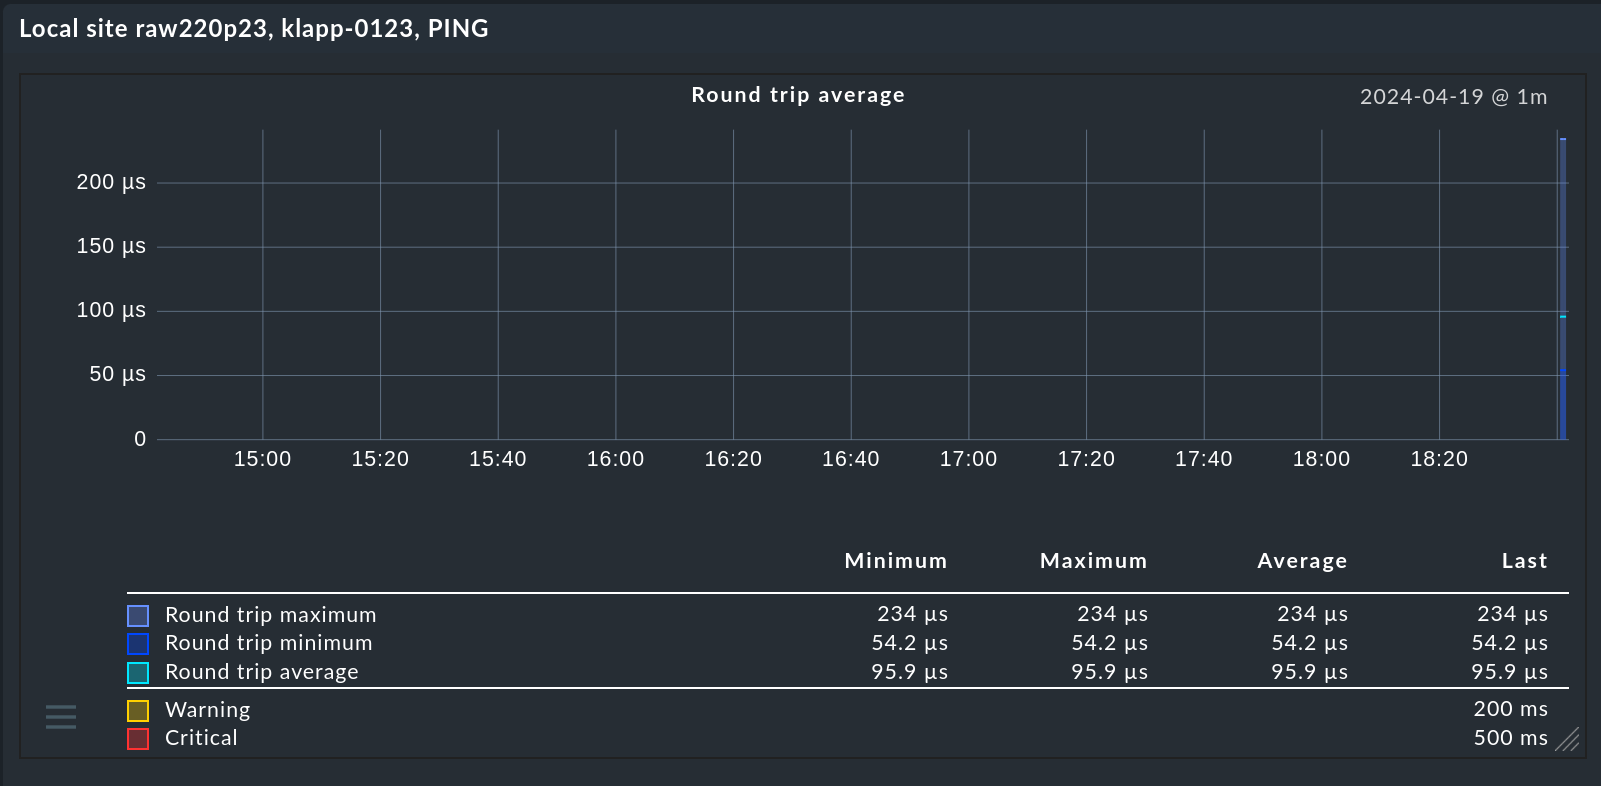
I checked this in 2.2.0p23 (RAW) and it’s the same there: without tuning the graphs get shown auto-scaled (and in my case, because of localhost, in µs).
I think you should remove the graph tuning and get them shown in auto-scale, too…
BR,
Marsellus W.
Hi There
Thank you for your response. I am using enterprise and the reason for using the tuning is because the default is also 1s (1000ms) for RTA graphs/output - in emails, views, etc.
This is why I started trying the graph tuning route.
Why would the default then not auto scale - is there perhaps a specific pythong script or config file I can ensure is replaced with default (not that I made any backend changes) but we are using the “official” docker image - not sure if that might have an influence.
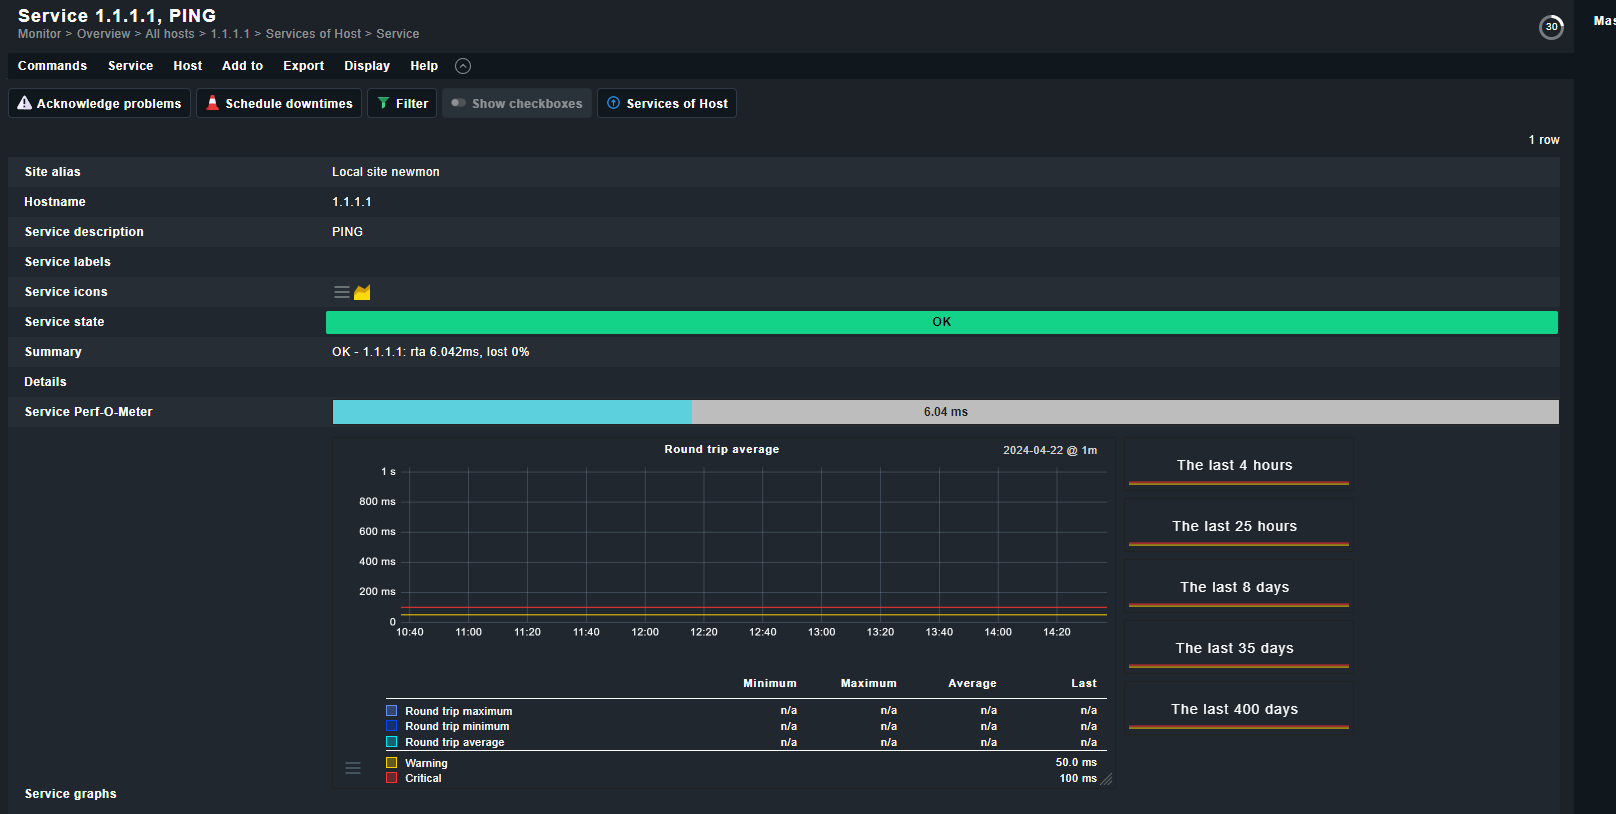
So I just installed a BRAND new RAW edition. and added only a single host (1.1.1.1).
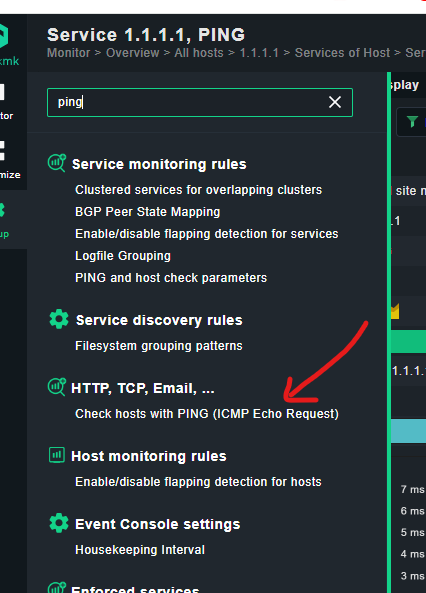
added check hosts with ping option and “default” graph is 1s (1000ms)
Since I have no other configuration, is it instead perhaps the incorrect service to use to monitor Ping/ICMP?
so in my test environment I was able to correctly simulate the axis by removing the “Check hosts with PING (ICMP Echo Request)” and leaving it without any config - I think I was too hasty in setup and didnt realise it had a “built-in” ping service. This seems to scale correctly! YIPPEEEE. but now when I remove the “Check hosts with PING (ICMP Echo Request)” from all hosts, it does revert to the default ping check command, but scale remains (even after rediscovery). Unlike the test environment where it returns to expected scalaing once “Check hosts with PING (ICMP Echo Request)” is removed.It seems the one uses check_ping service command and the other check_icmp, or something along those lines
How can I rectify the scaling/default ping command/mothod to have the axis auto scale as per test environment now that I seem to have idendified the cause?
Based on all testing, research and trial, the only way I can see moving forward is to re-install.
Here’s to re-adding and configuring 800 hosts.
So just before I went that route I attemted one final thing. Upgraded from 2.2.0p22 to check-mk-enterprise:2.3.0b6 AND ITS SOLVED!!!