How do get a Host / Service Graph, but avoid double PING?

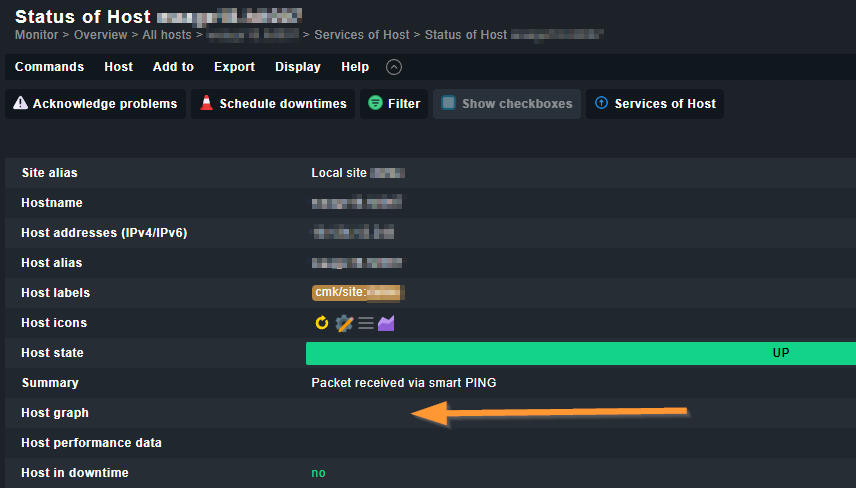
I did something wrong:

All hosts with an installed CheckMK Agent do not have a separate PING service in their service list. As the default for Host Checks is “Smart PING”, the host graph was empty:

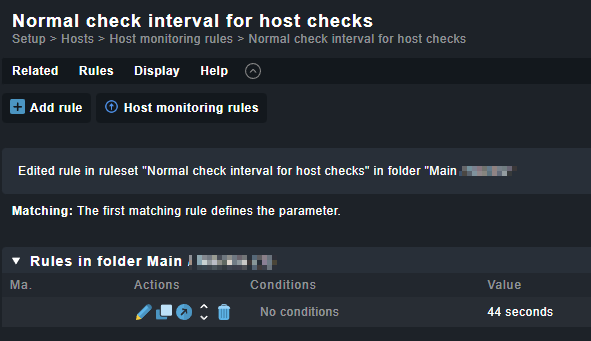
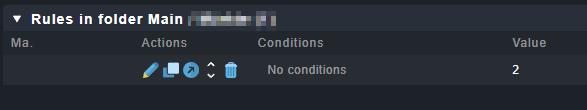
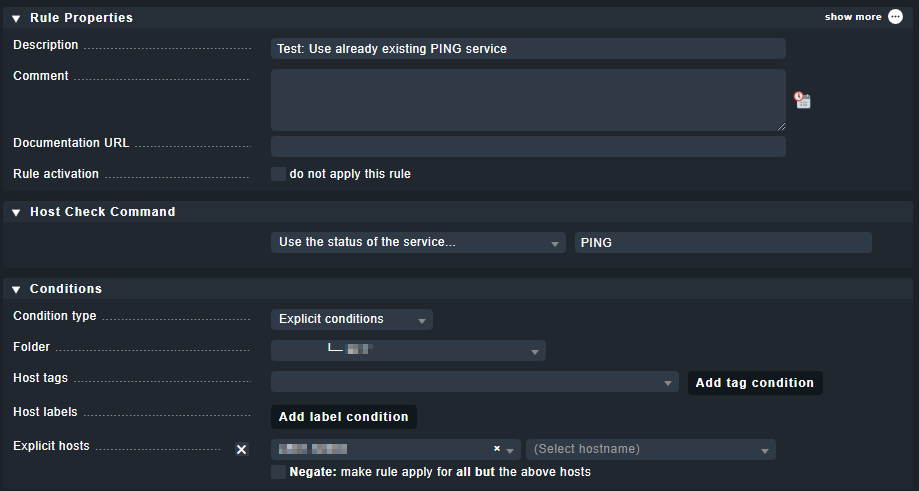
So I did some research in the forums and followed the hint to use the “Host Check Command” rule to enable “PING (active check with ICMP echo request” as the new default for all hosts, to get a nice graph:
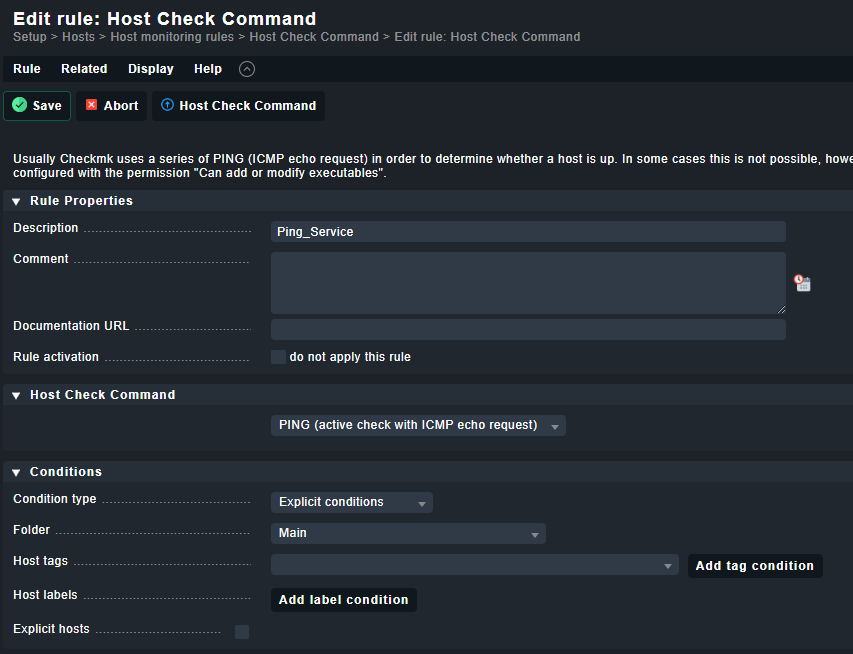
And yes, it worked:

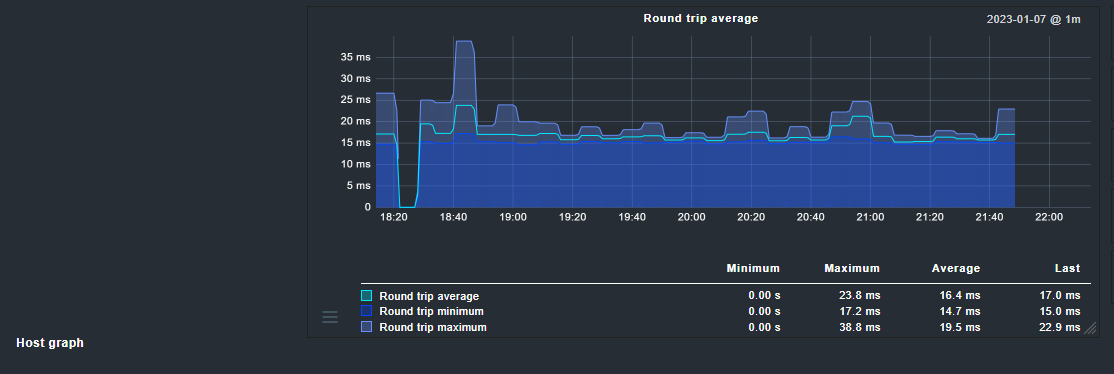
By that the Host Check Command changed to “check-mk-host-ping”:

image

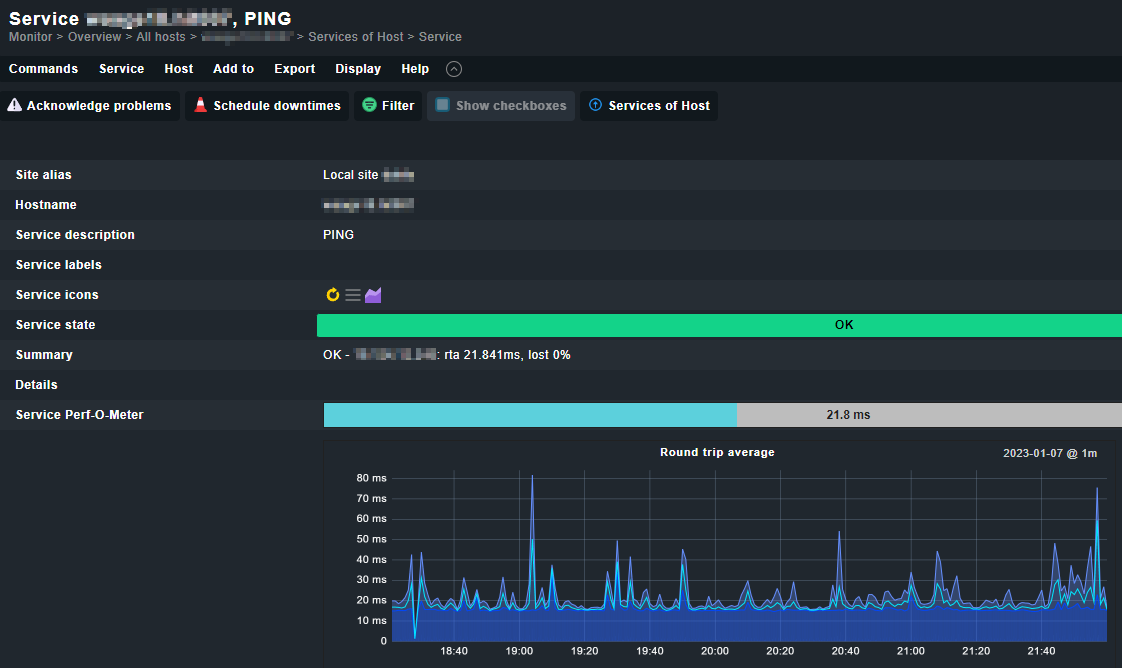
At first it seemed like a good idea, but now I found out that all hosts without the CheckMK Agent are receiving twice as much PING as they already have a PING service which is called “check-mk-ping”:

Which creates a graph, too:

I think I could solve this as follows:

A) Use the default Smart Ping for Host Status Checks and add a PING service to all Hosts with CheckMK Agent.

B) Use “PING” for Host Status Checks only if the CheckMK Agent is used.

C) Make PING the default Host Status Check and disable the PING service for all hosts.

What is the best way and how do I realize it? For me it seems “A” is the worst as Smart PING and the usual PING Service do produce double PINGs, too. But “A” is the easiest for the user as many do not find out that they need to click on the hostname to get the Host (PING) Graph.

The best option of all would be:

D) All hosts have a PING service in the list, but all of them are linked to the Host Status page which is set to PING.

But I think this isn’t possible, correct?

EDIT: This is the description of Services > HTTP, TCP, Email > Check hosts with PING (ICMP Echo Request

This ruleset allows you to configure explicit PING monitoring of hosts. Usually a PING is being used as a host check, so this is not neccessary. There are some situations, however, where this can be useful. One of them is when using the Check_MK Micro Core with SMART Ping and you want to track performance data of the PING to some hosts, nevertheless.

Does it mean Smart PING uses the data of a separate PING service to check the status of a host or does it still produce double PING?

This is changed in 2.0 so not your “fault”

We only add “real” ICMP to hosts when we have network issues. Otherwise we would detect regular issues with the service “Check_MK” as that collects time it takes to talk to the agent etc. Also smart ping will make the Check_MK service CRIT if smart ping fails and the host should be seen as down.

To check if a host was offline yesterday between X and Y, it’s much faster to make a single click on the PING service and view the graph than using Services > Availability > Change computation and display options to influence the size of the bar etc.

And if you need to compare the network traffic of different hosts (because they are connected to the same switch and you want to know if a problem is present only for those hosts), you can easily open X tabs with PING charts and compare them.

So the PING graph results in a much better user experience.

Finally I solved the issue as follows:

  • removed Hosts > Host monitoring rule > Host Check Command > PING rule so Smart PING is the default again
  • added a PING service to all hosts through Services > HTTP, TCP … > Check Hosts with PING
  • added Services > Service monitoring rules > Normal check interval for service checks and set the PING service intervall of all hosts except specific ones to 5 minutes (and some even less important to 15 minutes):

In a last step I had to change the Host Check (Smart PING) Interval for a folder which contains a huge amount of external hosts (connected through VPN) from 6 to 44 seconds. This was needed as 6 seconds produced too many false-positive host states.
image

I choosed 44 seconds, because 2,5 intervals are 110 seconds and a service is only set to CRITICAL if fails for 2 service intervals, which are 120 seconds:

“Maximum number of check attempts for service” rule:
image

By that it should not cause false-positive notifications.

The result is promising:
Our 35 days average server load was reduced from 20.5 to 7.6 in the last 4 hours.

A final question:
Is it possible to remove the historical data of the Host graphs? It seems CheckMK does not delete them while switching between PING and Smart PING (If I re-enable the PING check, it shows the old performance data as well).

Found an alternative solution:

  • add a PING service to all hosts through Services > HTTP, TCP … > Check Hosts with PING
  • Hosts > Host Check Command > Use the status of the service > PING

By that it does not produce additional Smart PINGs and relies completely on the already existing PING service.

Note: “Maximum number of check attempts for service” must be 2 times larger than the PING interval to avoid false-positive service notifications.

But I’m not using this solution as Smart PING is much faster in recognizing a host state and a usual PING service with an extremely short interval, produces unnecessary CPU load. So I still use Smart PING (6 or 44 seconds interval) as Host Check and the additional PING service with 1, 5 or 15 minutes interval depending on the importance of the host to get the needed graph.

PS All optimizations (the above and changing some other intervals) reduced our CheckMK Server load from 1,7 per core to 0,3. This was a huge optimization :ok_hand:

This topic was automatically closed 365 days after the last reply. New replies are no longer allowed. Contact an admin if you think this should be re-opened.