I often would like to combine all metrics M of a service S of a series of hosts in a single combined graph. So far I create a custom graph and then click together the data through the “metrics” pane. This is a pain for large number of hosts (10, 20, 30,…). Is it possible to do that in one go? Like saying “please combine all metrics M of service S of hosts abc-* in one graph” or similar. Setting color and style afterwards manually is acceptable, but of course it would be even greater, if the style could be defined at the beginning and if random colors can be assigned to the graphs.
Are you using the Enterprise Edition? If so, you can use combined Graphs which can be found under
if you have only the CRE, then this feature is not available.
You could try to build/edit the var/check_mk/web/<your_user_name>/user_custom_graphs.mk file by script. (not sure if there are REST-API calls available for this.)
Yes, we have the Enterprise edition. However when I use this command, I still have only one graph with the metrics of this specific host. How can I easily add the same metric of the other 19 hosts to the same graph? I’d prefer an UI based solution, as I don’t know anything about *.mk files (yet)
by default the “all metrics of same type” sums up all graphs, do you want them in single lines?
“Lines” or “Stacked” might be what you are looking for depending on the use case:
I think I am doing something wrong: I have twenty hosts and I need the overlay of the “Time usage by phase” of the Check_MK service for all these hosts in one(!) graph:
I search for the first host
I click on the graph for the Check_MK service
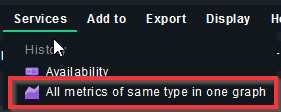
I select Service → All metrics of same type in one graph
The result is a graph with “Time usage by phase” of the Check_MK of only this specific host. How can I add the other 19 hosts to this graph? If I redo the procedure with an other host, I get again the graph only for the specific host and the metrics are not added to the first graph.
Search for all the hosts (using regex/tags/labels) and filter for the service you need → then when you have a list of your 20 hosts, select „all metrics…“ and the combined graph will add all hosts‘ metrics into one graph.
Drawback: if the service graph usually has 3 different values per host, all of these will also be in the combined graph
This topic was automatically closed 365 days after the last reply. New replies are no longer allowed. Contact an admin if you think this should be re-opened.