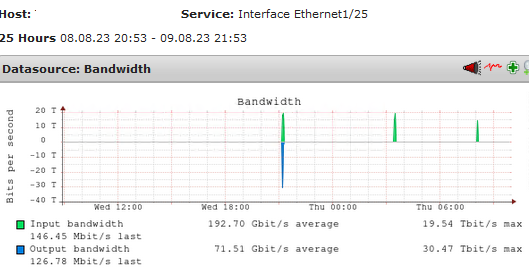
I have a problem about monitoring net interface bandwidth because CRITICAL alerts are displayed on 10 Gbps interfaces having input and output values over their capacity.
Check the alert below as an example – shown 44.5 GB/s whereas its speed is 10 Gbps.
Eth1/3 Admvo_281000028274, Ethernet1/30], (op. state: up, admin state: up), MAC: 3C:26:E4:2A:B1:08, Speed: 10 GBit/s, In average 15min: 44.5 GB/s (warn/crit at 875 MB/s/1.12 GB/s) (3562.53%) **CRIT**, Out average 15min: 3.29 GB/s (warn/crit at 875 MB/s/1.12 GB/s) (263.35%):
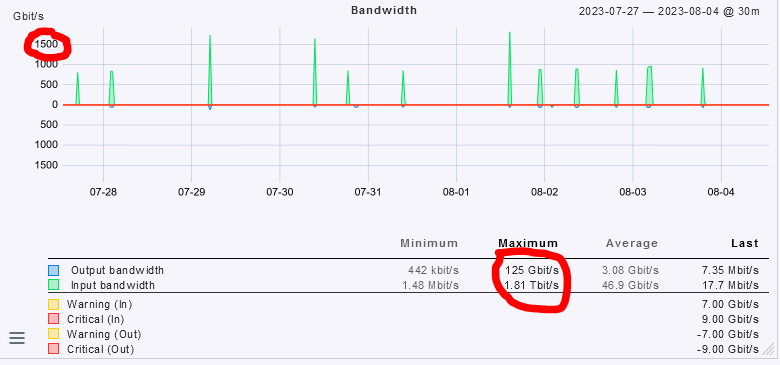
Obviously it is a problem because of the alerts Check_MK throws. See the values and alerts reported for last 8 days
The solution reported by support is “In your case the first obvious thing is the increased polling interval.” according to this page they shared. Surprisingly they did not suggest to update to the latest release as they usually do… that gives me no hope that they will solve this issue.
The “Average values for used bandwidth” is 15 minutes. Is it too long? Is there a proper value?
Do anyone know any other tool/plugin to check interface bandwdith properly?
I have more than 200k network ports inside all the CMK systems supported from myself or my colleagues and no such problems.
What is the check interval configured on this device?
Is in your system any of the following rules defined?
Fetch intervals for SNMP sections
Normal check interval for service checks
That affect the ports on this network device.
Despite the fact that we have fairly large setups too, apparently
“bandwidth calculation” over “averaged time periods”, may be an issue
after all, if one reads the KB article you posted:
We are seeing this exact issue in an old CRE1.6 (nagios core) server on Centos 7. (we have enterprise licensing and project is in progress to upgrade it to CEE 2.0 ). The switch being monitored is a Cisco Nexus 9K (N9K-C93180YC-FX) and its a 1GB port. check interval is 1min. No other ports are showing this issue.
We thought it might be a pnp4nagios issue so we deleted the rrd for the interface and let it regenerate but same issue came back.
We have an even older monitoring server running checkmk 1.2.x (icinga2) monitoring the same class of switch and no sign of this issue.
I dont know if this info has any usefulness to your investigation due to the age of our applications and no micro core, but we stumbled upon this thread doing our own research and thought it was interesting. I will update once we have upgraded the DR for the server to CEE 2.0/CMC and see if anything changes. If there is any more info I can provide that may be of use, let me know.
I don’t think that this is related, but please go ahead and prove me wrong
In this thread post I provided a modified interfaces.py that can be put to the~/local structure and
overshadows the factory version of that interfaces check.
It is just extended to log the raw rx/tx octest it got from the device and some related, calculated vars.
Perhaps it is possible for you to use it on a test instance of your checkmk for the device ?
If you have question please do not hesitate to contact my by private message.
My interest in this topic is to mythbuster that checkmk does it wrong.
This topic was automatically closed 365 days after the last reply. New replies are no longer allowed. Contact an admin if you think this should be re-opened.