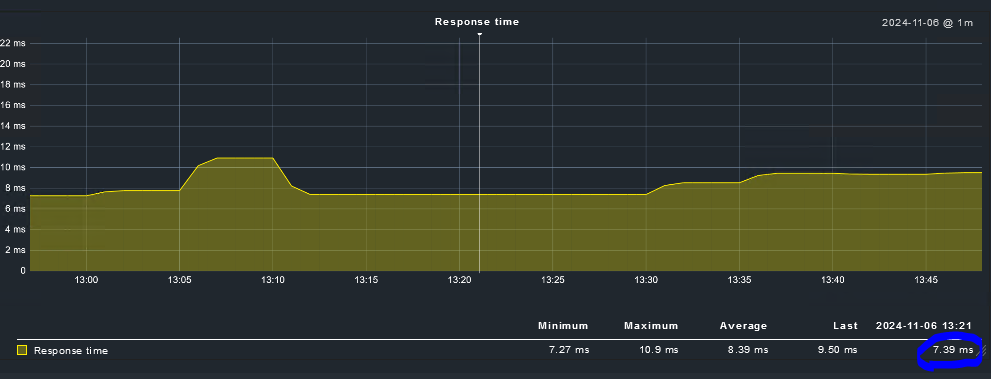
Please, Can someone from CheckMK tell us why the graphs maintain the last value when no data points are being collected? This does not reflect the real situation. If no data points are being collected, the graph should be empty (zero value) for the time interval without data.
This behavior has to do with the heartbeat feature of RRDtools.
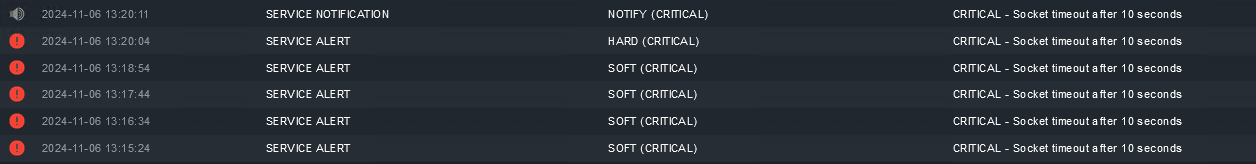
The heartbeat give a time span that is needed before RRDtool is showing zero values. Keep in mind that at a “Socket timeout” as it is shown in the first screen no value for the performance data is written.
No value does not mean 0 but really no value.
interval
RRDtool will normalize the rates it computed (or got from you, in case of a GAUGE data source type) into what you specified as the step size. But you don't need to update this often if you don't want to.

You need to understand the heartbeat value. This value determines if an update is fresh enough, see rrdtool create if you missed it.

If your heartbeat value allows it, you can span many steps with one single update:

rrdtool update 1235775600:0
rrdtool update 1235818800:1
The time difference is 43200 seconds. If heartbeat is at least that number, then all time slots between 1235775600 and 1235818800 are filled with rate 1. Else, the same time slots will be unknown.
This page http://rrdtool.vandenbogaerdt.nl/ in general is a very good source for in depth information about RRD structure and how it behaves.
If you change the heartbeat of your RRD files then you can also see shorter intervals with missing data in your graph.
8460 seconds → 141 minutes → if there is one entry every 140 minutes you will see a line in your graph
You see that it is possible to define heartbeats for every data source.
Conclusion - all the shown behavior is completely normal for default RRD configuration.
This topic was automatically closed 365 days after the last reply. New replies are no longer allowed. Contact an admin if you think this should be re-opened.