CMK version: Checkmk Raw Edition 2.4.0p17
OS version: Alma 10
Is there a minimum “interval for service checks” to make checkmk generate graphs correctly?
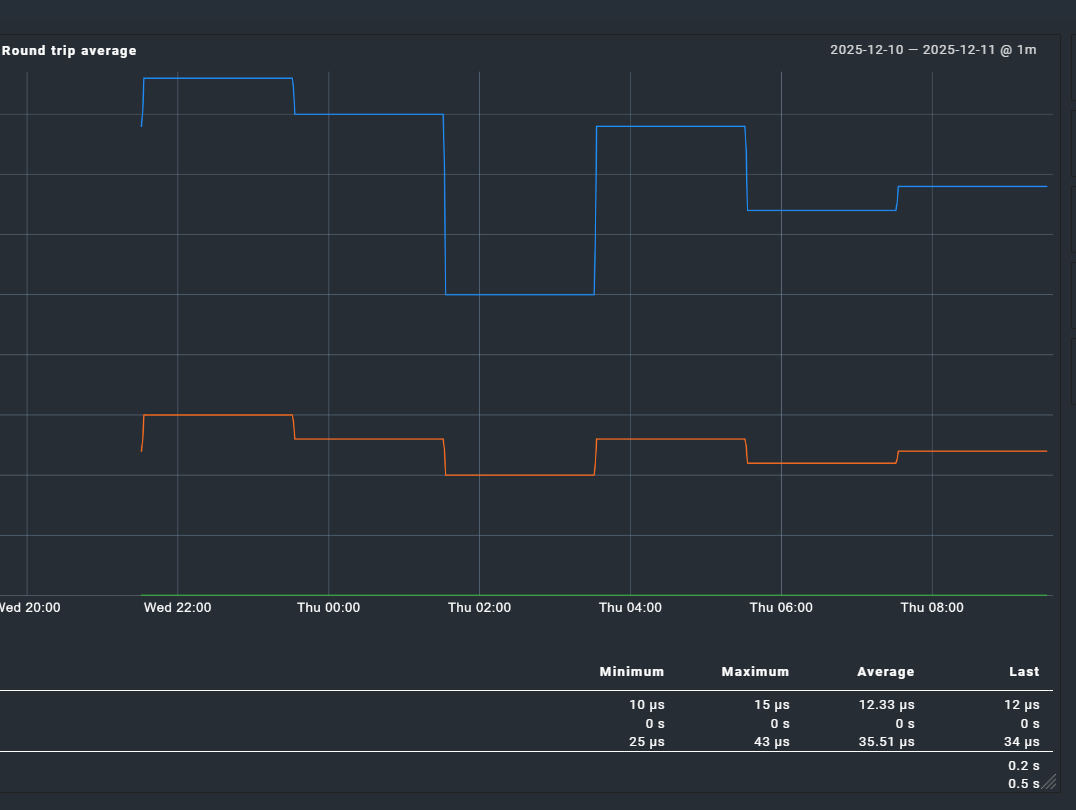
When service checks have an interval of <= 2 hours, graphs are generated.
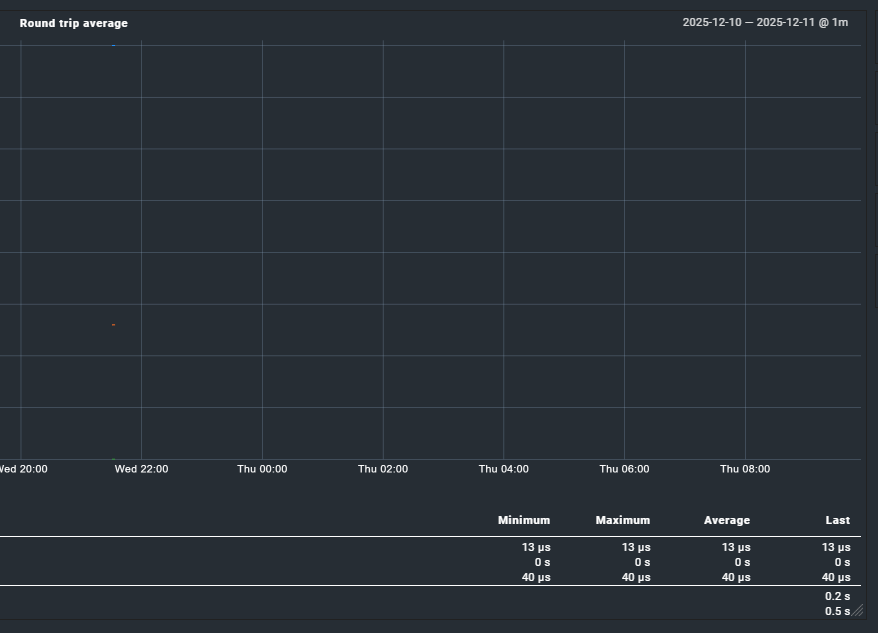
When service checks have an interval of >= 4 hours, graphs are empty.
This seems to happen with every type of service\check.
Below examples of this behavior with a “Check hosts with PING (ICMP Echo Request)” check. The two services shown were created just to test this issue and they are both ping to 127.0.0.1; the only difference is the check interval.
While the graphs are broken, according to the service stats\summary the check is working correctly even with a 4hr check interval:
OK - 127.0.0.1 rta 0.010ms lost 0%
From that thread:
CRE users can change the RRD heartbeat value of 8460 seconds inside the config file ~/etc/pnp4nagios/process_perfdata.cfg, CEE users would need to change it inside a python file of Checkmk: ~/lib/check_mk/base/cee/rrd.py (but this would be overwritten by updates).
In the meantime i asked chatgpt and i’m trying this change to the ~/lib/python3/cmk/rrd/rrd.py file:
# Dynamic heartbeat based on step if step > 8460: rrd_heartbeat = int(step * 1.2) else: rrd_heartbeat = 8460
this should make the hearbeat dynamic and tied to the check interval when the interval is > 8460.
not sure yet it makes sense\will work.
also, afaik it would be dynamic when the graph is initially created.
but if a service check interval is later changed to a longer one, the graph issue would still be present for that service.
so maybe a static long heartbeat (24+ hours) is better.
with the advantage that it should be configurable via the process_perfdata.cfg file and not using a code hack (to be reapplied after any checkmk update)
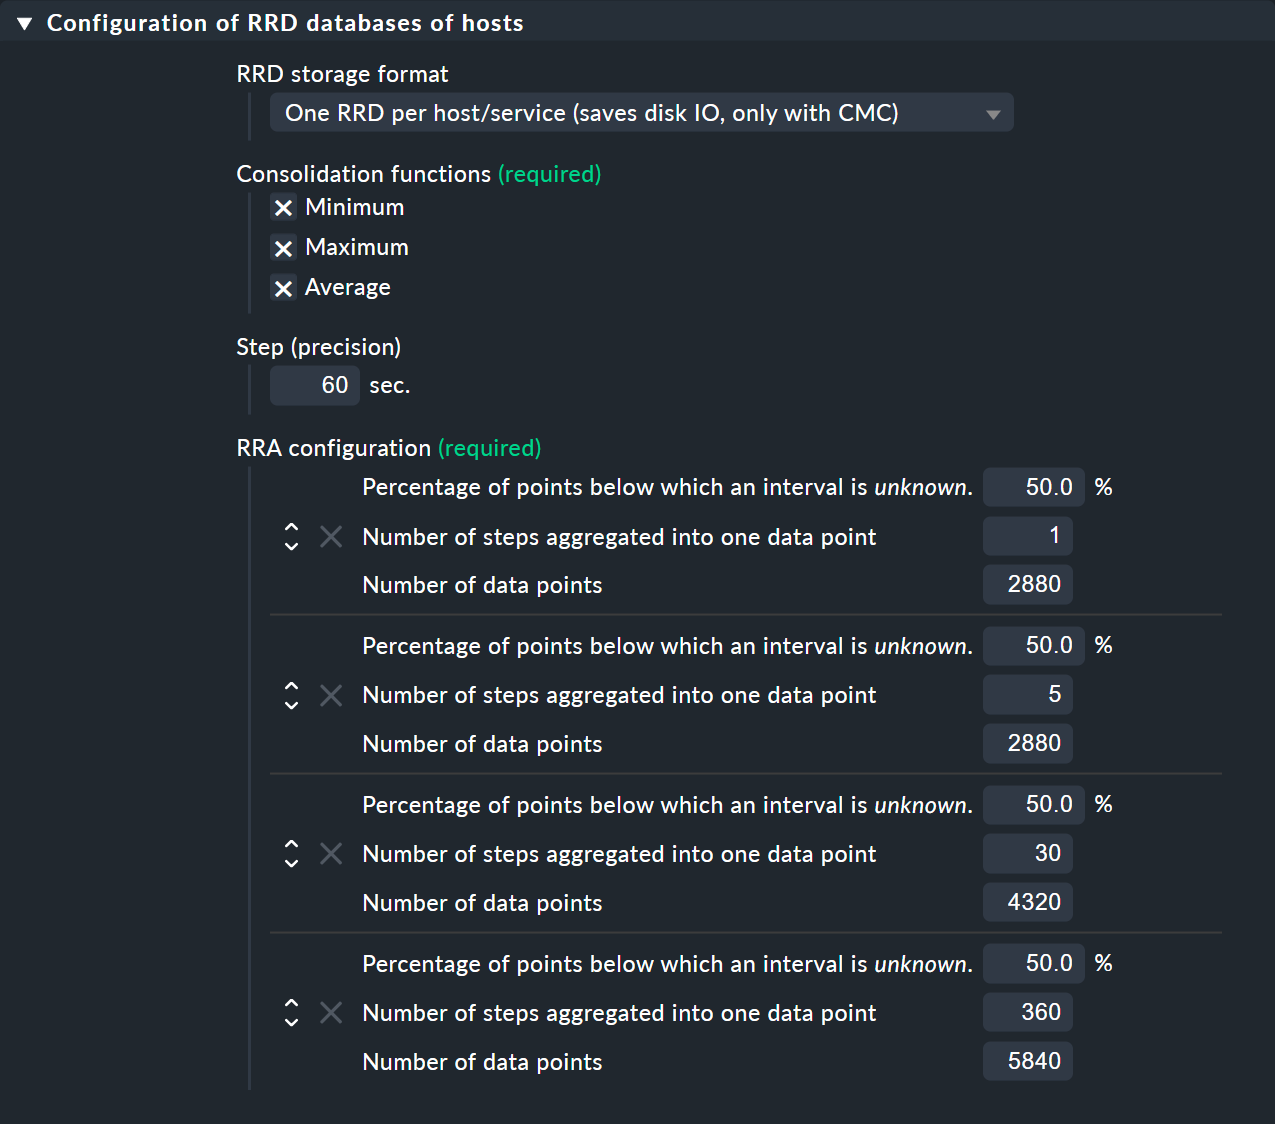
Attention step ist not the check interval. Step is the time between data points in seconds inside a rrd file that data is expected. You need to define a rrd creation rule inside checkmk (enterprise only) to get a different step value for a specific service.
For non enterprise installations you need to modify the process_perfdata.cfg file.
If you keep the default 50% it means that at the next level of aggregation 50% of the aggregated data points must contain a value.
Example - first aggregation uses 5 steps (normally 5 times 60 second intervals) to build one aggregated value. Now we need 50% of these 5 values (3) to get a valid aggregated value.
This article RRDtool - rrdcreate and the following paragraph gives a little bit more insight to the doing of rrdtool.
This is from the documentation about the 50% value –> here known as xff
xff The xfiles factor defines what part of a consolidation interval may be made up from *UNKNOWN* data while the consolidated value is still regarded as known. It is given as the ratio of allowed *UNKNOWN* PDPs to the number of PDPs in the interval. Thus, it ranges from 0 to 1 (exclusive).