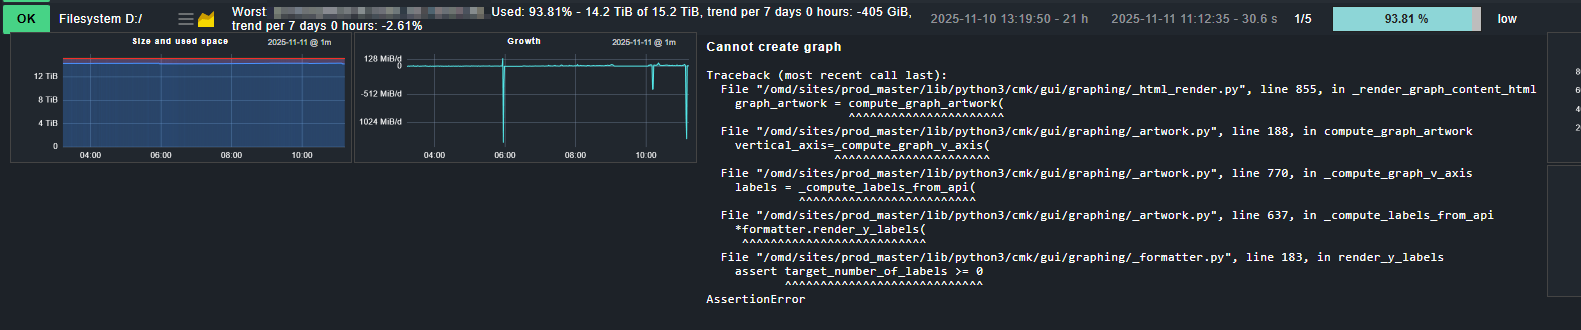
We have updated our production from 2.3 to 2.4. Now we have two open issues regarding graphs. Firstly, we occasionally see an exception when we hover over the graph icon at file system service. When you click on the icon, you can see the graphs and the exception disappears.
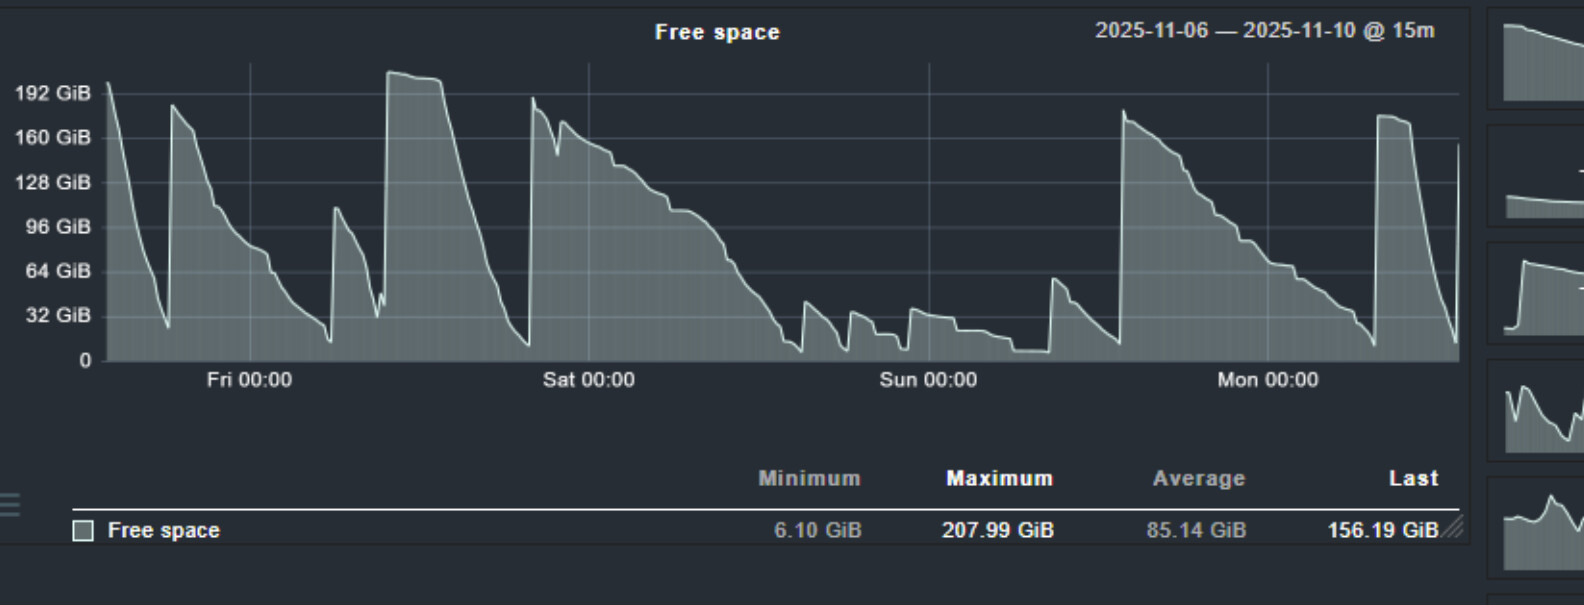
The second issue is that, at least on Windows systems, a diagram is now missing, namely the free space diagram:
None of our Windows servers show a “Free Space” graph — only a “Used Space” graph is available on 2.4.0p11.
Could this behavior be related to the threshold type (used vs. free space)?
We usually configure “used space” levels. Does the selected type determine which graph is displayed?
In 2.3 there is the free space graph available. I double checked it in my environments. At 2.4.0p15 I get no exception like this. Looks like that some data missing to render.
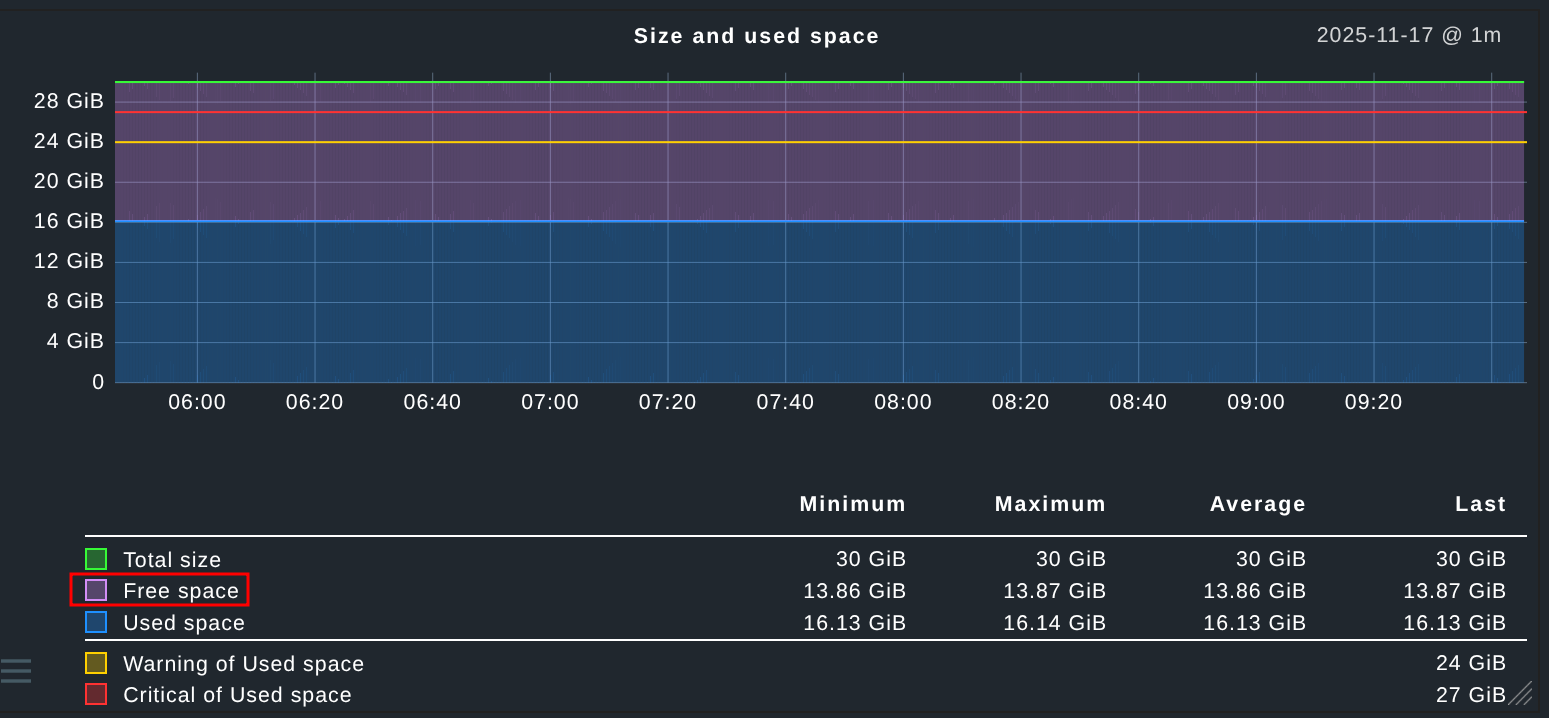
For your information, free_space is also displayed in the “Size and Used Space” chart, but it’s often barely noticeable on very large file systems. My colleagues actually look at this chart frequently because it allows you to quickly see the development of free_space.
And if the diagram has been removed, is that mentioned anywhere in the werks? I couldn’t find it there, so it’s unclear whether it’s a bug or intentional.
As mentioned by Martin, in Checkmk 2.4 we cleaned-up some of our graphs as part of the migration to the new Metrics API. This included removing the ”Free space” graph because its data is already fully covered by the “Size and used space” graph. This change helps to reduce redundancy.
I agree with you to clean up some things. But this need to be anounced. We as a partner get these errors and spent a lot of time to find these problems and fix it.
As an idea: Put the cleaned graphings in a mkp collection of old graphs, so the user can decide if he need it or not, or put it in a werk to find it faster.