Hello everyone,
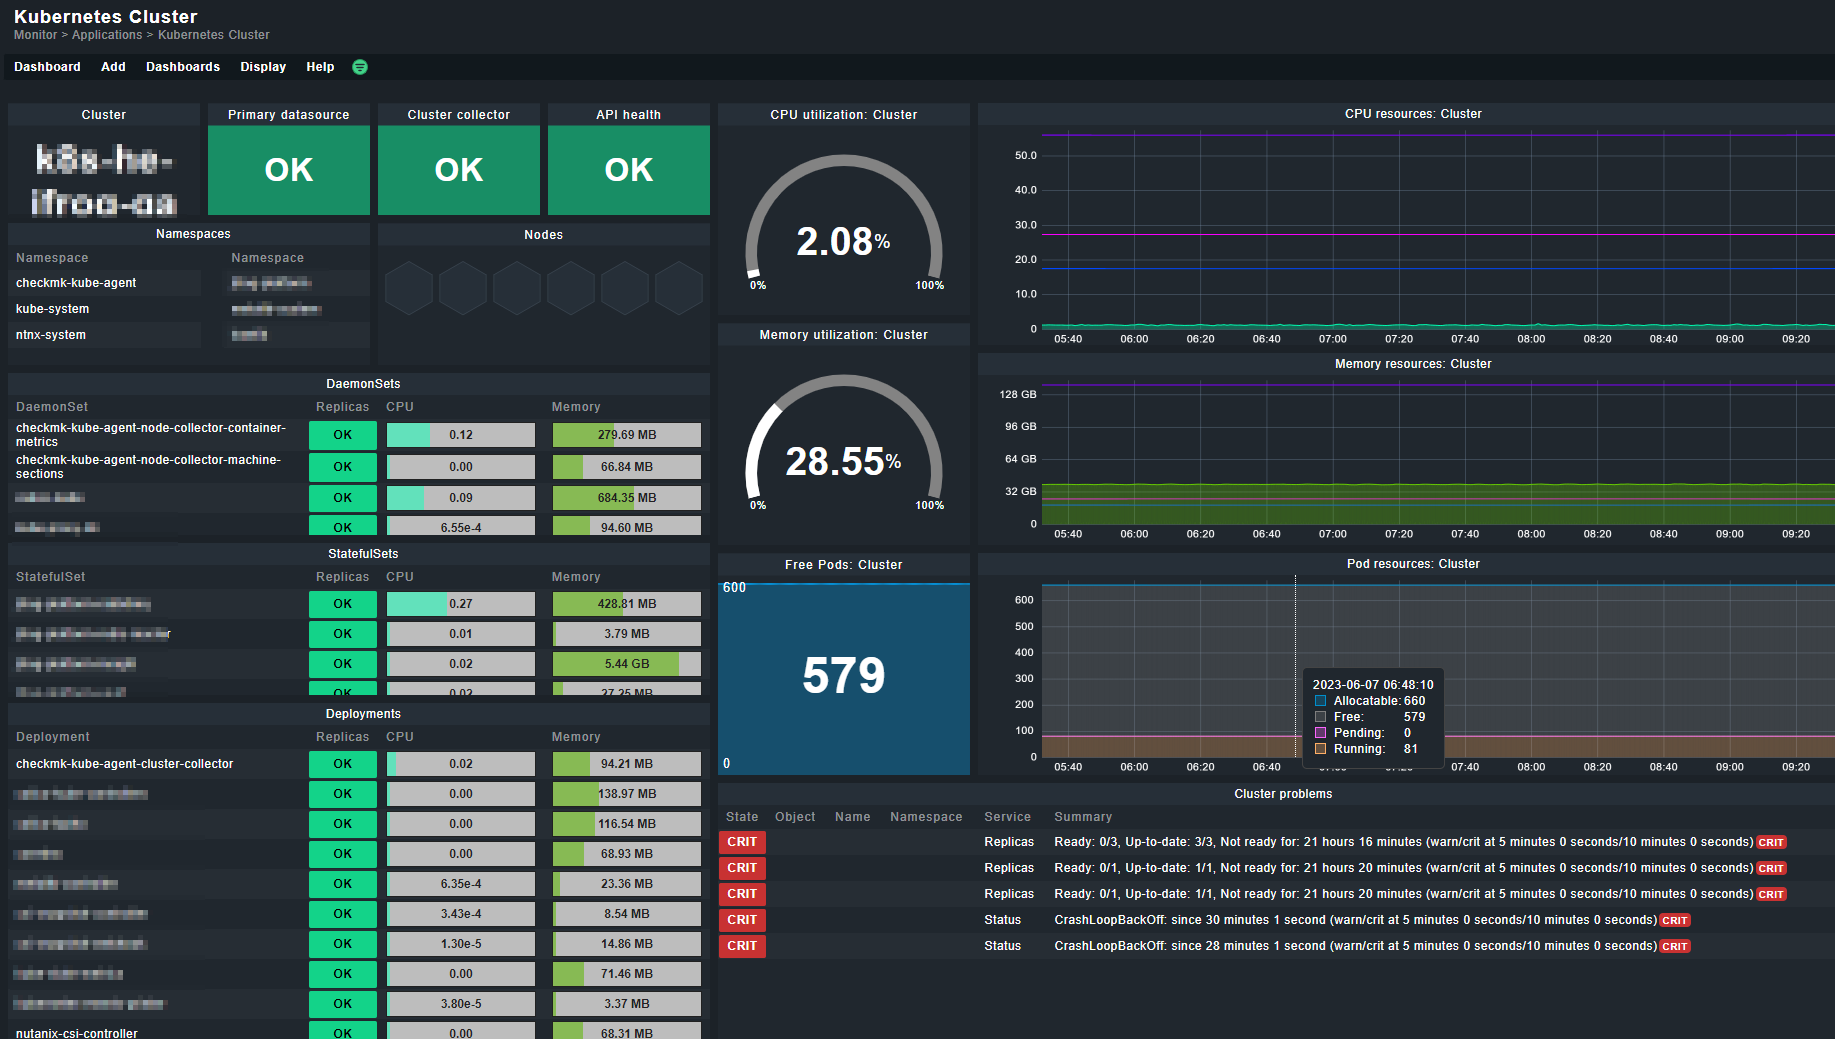
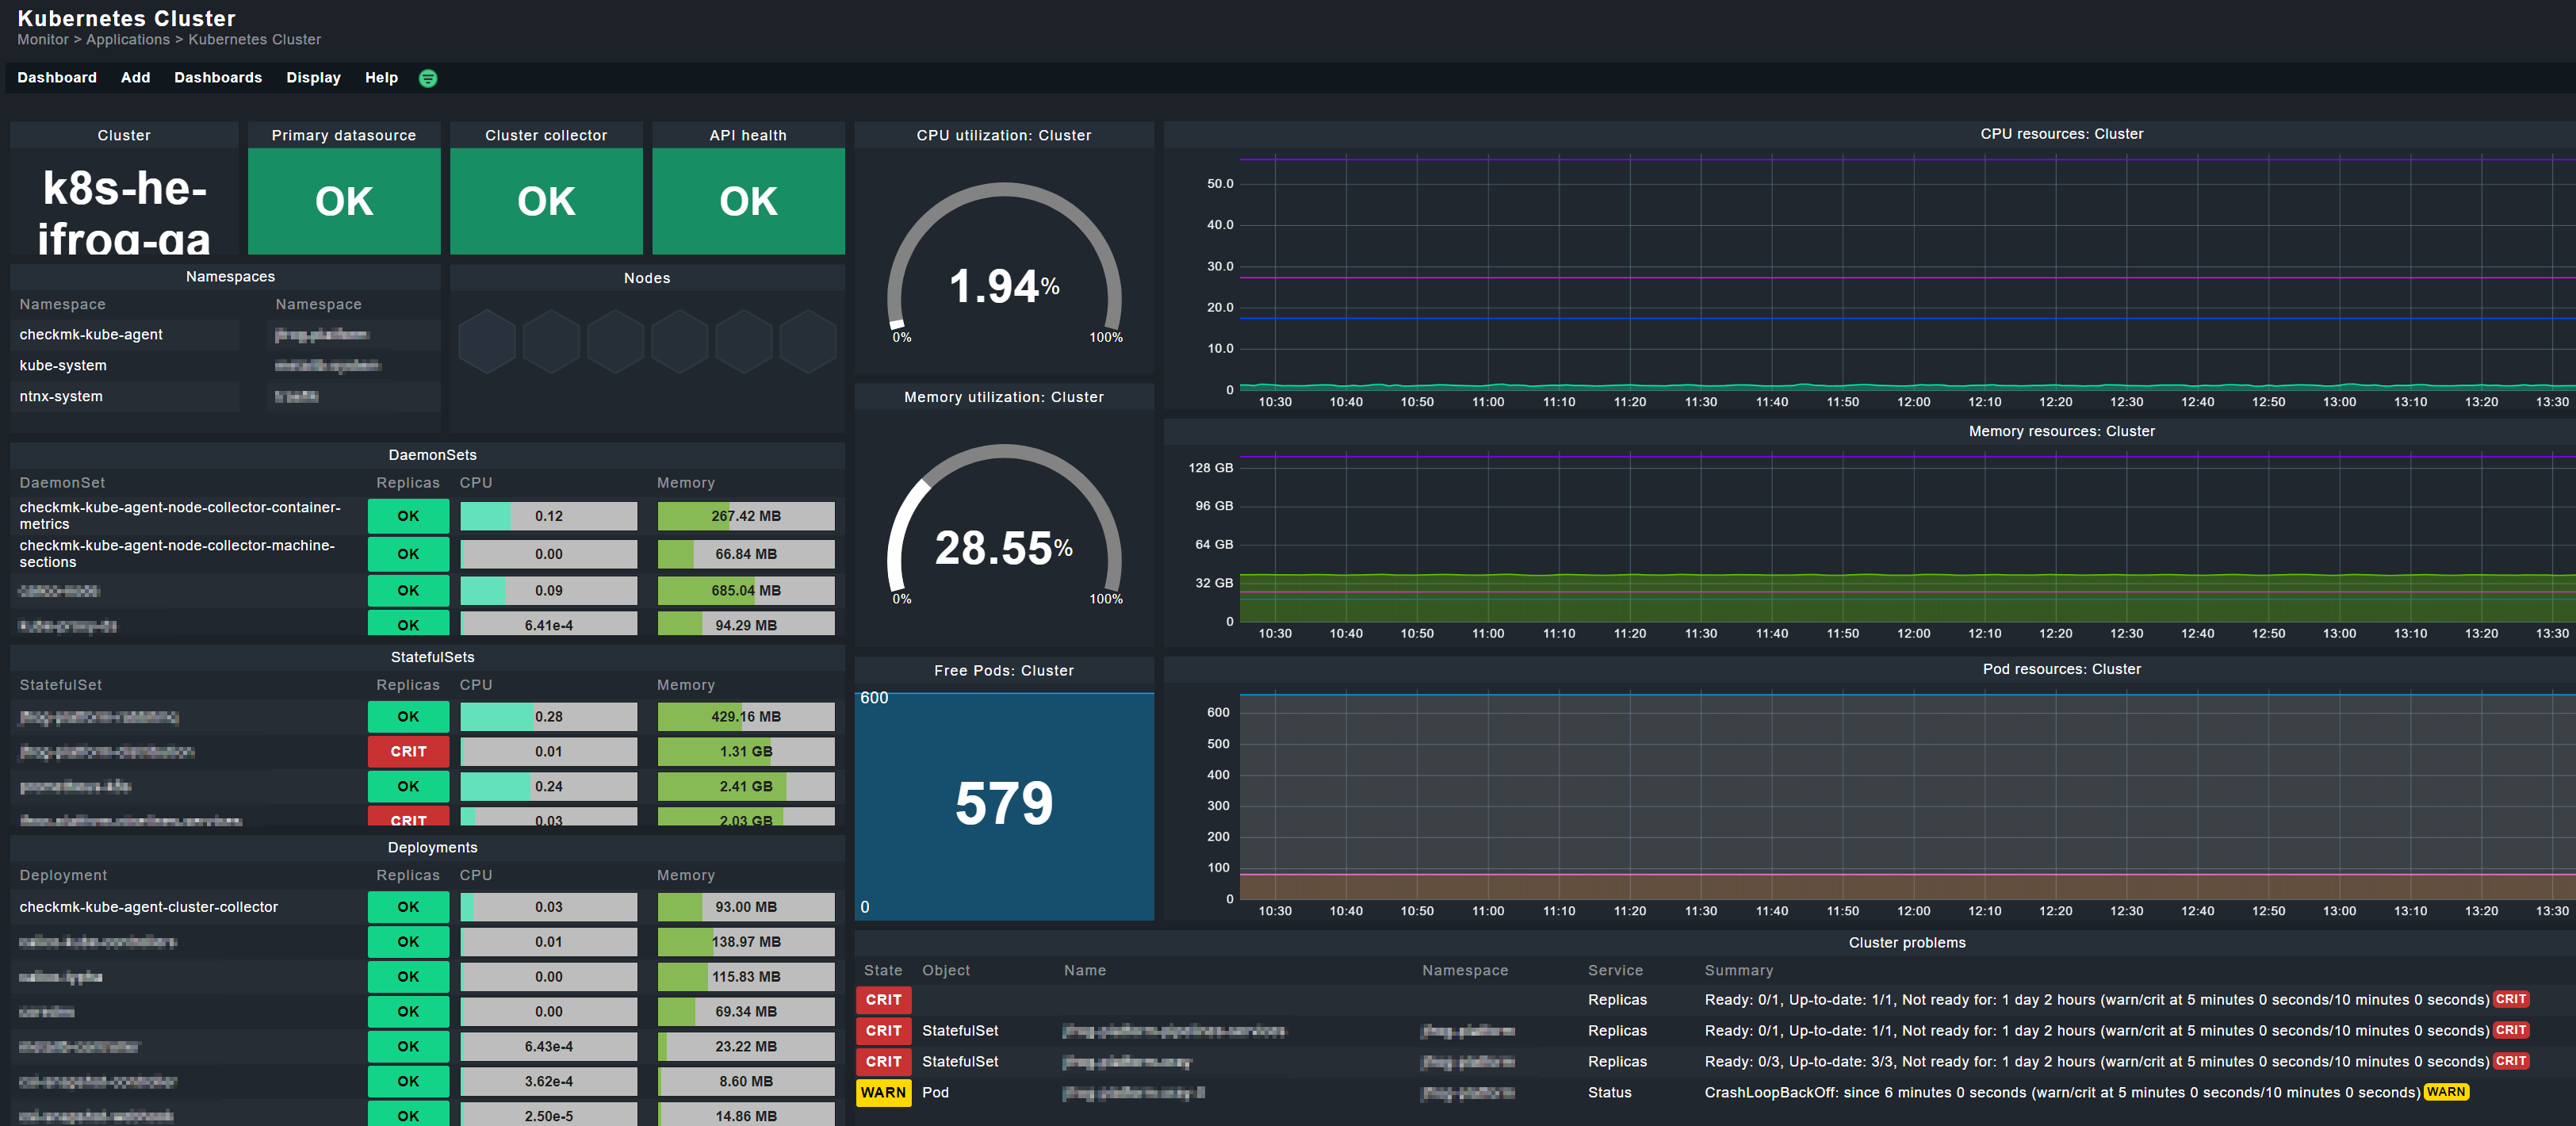
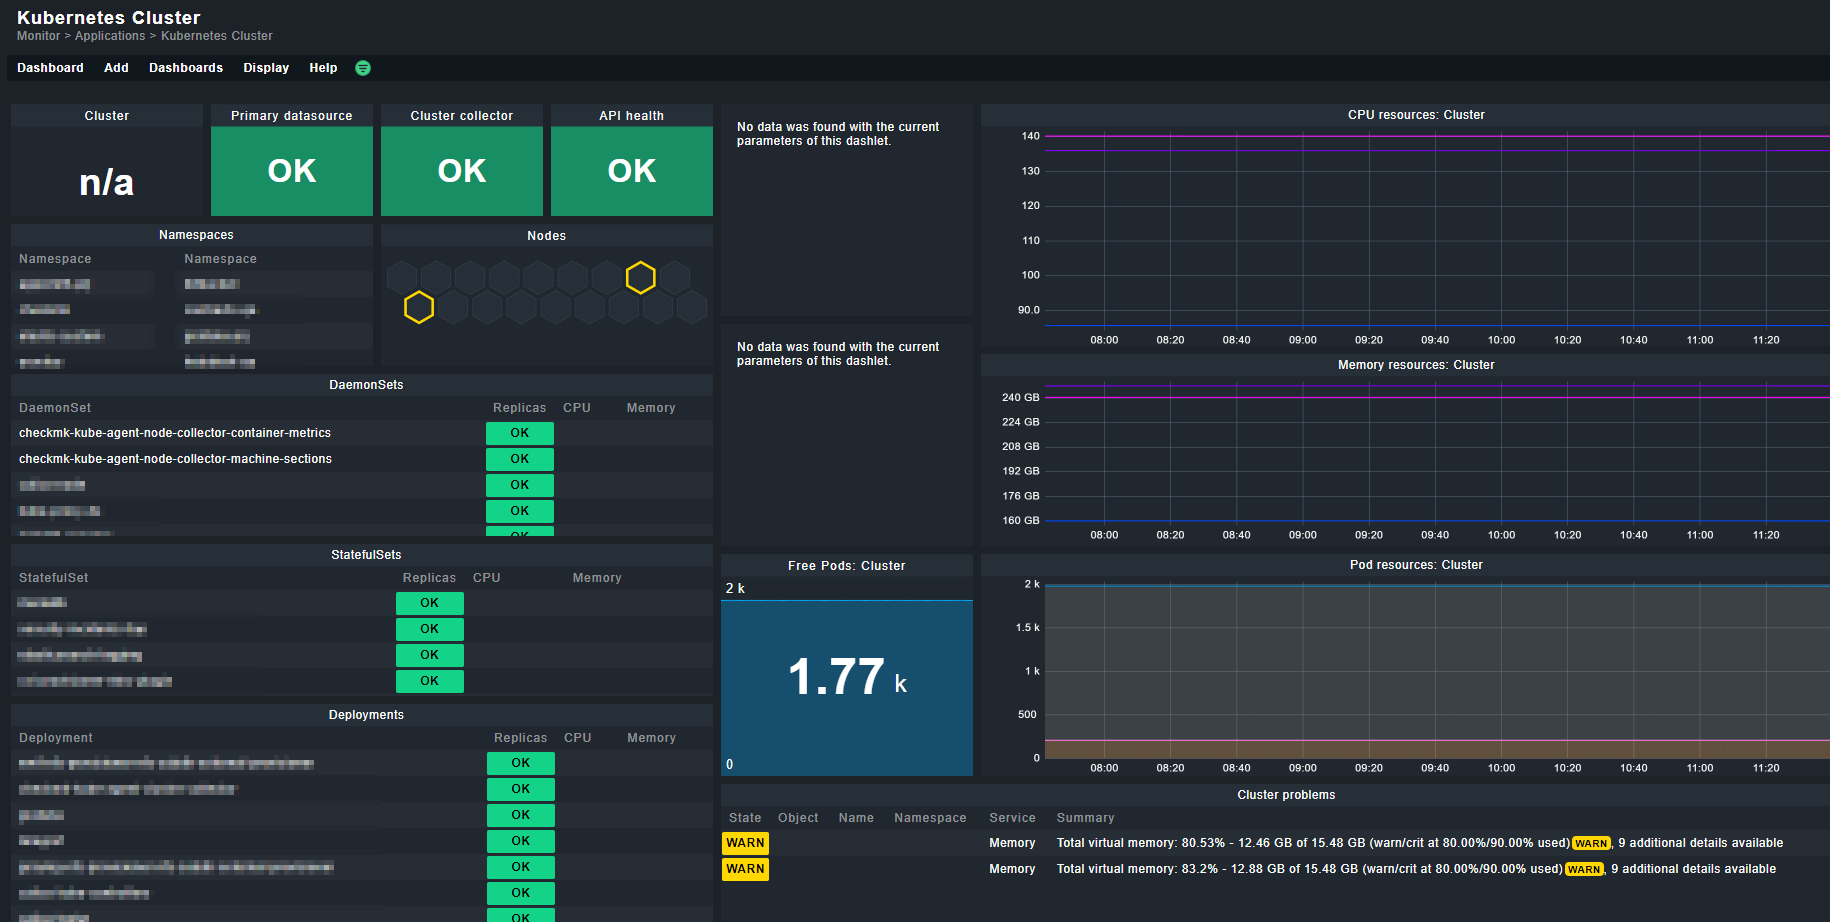
I added one of our K8S Cluster to checkMK. After that, the dashboards are filled only partial. Container metrics are missing. Maybe it is has something todo with the patched checkmk-cadvisor version?
Any ideas how to get the container metrics collection to work?
CMK version: 2.1.0p28.cee
OS version: Red Hat Enterprise Linux release 9.2
Error message: None. Empty values for container metrics
Cluster collector:
Cluster collector version: 1.4.0, Nodes with container collectors: 16/16, Nodes with machine collectors: 16/16, Container Metrics: No data, Machine Metrics: OK
Kubernetes API:
Live, Ready
Nodes:
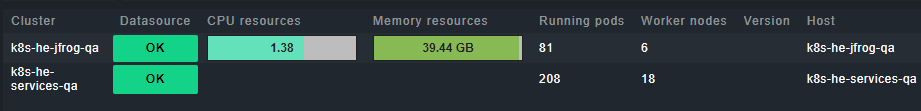
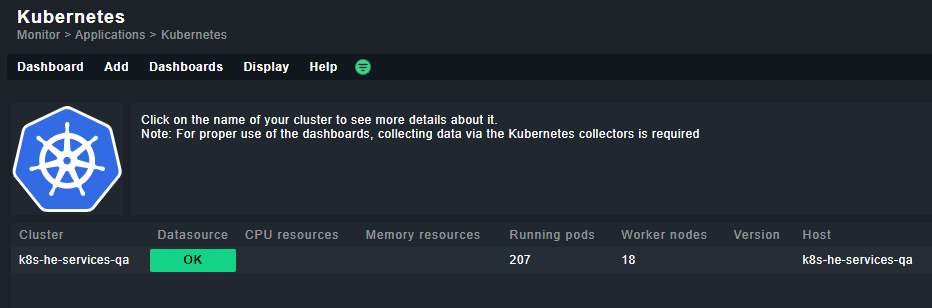
Worker nodes 18/18, No control plane nodes found
Pod resources:
Running: 207, Pending: 0, Succeeded: 12, Failed: 0, Unknown: 0, Allocatable: 1980
Output of “cmk --debug -vvn hostname”: (If it is a problem with checks or plugins)
Checkmk version 2.1.0p28
Try license usage history update.
Trying to acquire lock on /omd/sites/sitename/var/check_mk/license_usage/next_run
Got lock on /omd/sites/sitename/var/check_mk/license_usage/next_run
Trying to acquire lock on /omd/sites/sitename/var/check_mk/license_usage/history.json
Got lock on /omd/sites/sitename/var/check_mk/license_usage/history.json
Next run time has not been reached yet. Abort.
Releasing lock on /omd/sites/sitename/var/check_mk/license_usage/history.json
Released lock on /omd/sites/sitename/var/check_mk/license_usage/history.json
Releasing lock on /omd/sites/sitename/var/check_mk/license_usage/next_run
Released lock on /omd/sites/sitename/var/check_mk/license_usage/next_run
+ FETCHING DATA
Source: SourceType.HOST/FetcherType.PROGRAM
[cpu_tracking] Start [7f0aa0fba070]
[ProgramFetcher] Fetch with cache settings: DefaultAgentFileCache(k8s-he-services-qa, base_path=/omd/sites/sitename/tmp/check_mk/data_source_cache/special_kube, max_age=MaxAge(checking=0, discovery=120, inventory=120), disabled=False, use_outdated=False, simulation=False)
Not using cache (Too old. Age is 43 sec, allowed is 0 sec)
[ProgramFetcher] Execute data source
Calling: /omd/sites/sitename/share/check_mk/agents/special/agent_kube --pwstore=4@0@checkmk-kube-agent-k8s-he-services-qa-token '--cluster' 'k8s-he-services-qa' '--token' '****************************************************************************************************************************************************************************************************************************************************************************************************************************************************************************************************************************************************************************************************************************************************************************************************************************************************************************************************************************************************************************************************************************************************************************************************************************************************************************************************************' '--monitored-objects' 'deployments' 'daemonsets' 'statefulsets' 'namespaces' 'nodes' 'pods' '--cluster-aggregation-exclude-node-roles' 'control-plane' 'infra' '--api-server-endpoint' 'https://k8s-api-fqdn' '--api-server-proxy' 'FROM_ENVIRONMENT' '--cluster-collector-endpoint' 'https://checkmk-kube-agent-service-fqdn' '--cluster-collector-proxy' 'FROM_ENVIRONMENT'
Write data to cache file /omd/sites/sitename/tmp/check_mk/data_source_cache/special_kube/k8s-he-services-qa
Trying to acquire lock on /omd/sites/sitename/tmp/check_mk/data_source_cache/special_kube/k8s-he-services-qa
Got lock on /omd/sites/sitename/tmp/check_mk/data_source_cache/special_kube/k8s-he-services-qa
Releasing lock on /omd/sites/sitename/tmp/check_mk/data_source_cache/special_kube/k8s-he-services-qa
Released lock on /omd/sites/sitename/tmp/check_mk/data_source_cache/special_kube/k8s-he-services-qa
[cpu_tracking] Stop [7f0aa0fba070 - Snapshot(process=posix.times_result(user=0.020000000000000018, system=0.01999999999999999, children_user=2.23, children_system=0.21, elapsed=2.9500000001862645))]
Source: SourceType.HOST/FetcherType.PIGGYBACK
[cpu_tracking] Start [7f0aa0fba370]
[PiggybackFetcher] Fetch with cache settings: NoCache(k8s-he-services-qa, base_path=/omd/sites/sitename/tmp/check_mk/data_source_cache/piggyback, max_age=MaxAge(checking=0, discovery=120, inventory=120), disabled=True, use_outdated=False, simulation=False)
Not using cache (Cache usage disabled)
[PiggybackFetcher] Execute data source
No piggyback files for 'k8s-he-services-qa'. Skip processing.
Not using cache (Cache usage disabled)
[cpu_tracking] Stop [7f0aa0fba370 - Snapshot(process=posix.times_result(user=0.0, system=0.0, children_user=0.0, children_system=0.0, elapsed=0.0))]
+ PARSE FETCHER RESULTS
Source: SourceType.HOST/FetcherType.PROGRAM
<<<kube_pod_resources_v1:sep(0)>>> / Transition NOOPParser -> HostSectionParser
<<<kube_allocatable_pods_v1:sep(0)>>> / Transition HostSectionParser -> HostSectionParser
<<<kube_node_count_v1:sep(0)>>> / Transition HostSectionParser -> HostSectionParser
<<<kube_cluster_details_v1:sep(0)>>> / Transition HostSectionParser -> HostSectionParser
<<<kube_memory_resources_v1:sep(0)>>> / Transition HostSectionParser -> HostSectionParser
<<<kube_cpu_resources_v1:sep(0)>>> / Transition HostSectionParser -> HostSectionParser
<<<kube_allocatable_memory_resource_v1:sep(0)>>> / Transition HostSectionParser -> HostSectionParser
<<<kube_allocatable_cpu_resource_v1:sep(0)>>> / Transition HostSectionParser -> HostSectionParser
<<<kube_cluster_info_v1:sep(0)>>> / Transition HostSectionParser -> HostSectionParser
<<<kube_collector_daemons_v1:sep(0)>>> / Transition HostSectionParser -> HostSectionParser
PiggybackMarker(hostname='node_k8s-he-services-qa_k8s-he-qa-121-f59ae0-master-0') / Transition HostSectionParser -> PiggybackParser
PiggybackMarker(hostname='node_k8s-he-services-qa_k8s-he-qa-121-f59ae0-master-0') SectionMarker(name=SectionName('kube_node_container_count_v1'), cached=None, encoding='utf-8', nostrip=False, persist=None, separator='\x00') / Transition PiggybackParser -> PiggybackSectionParser
PiggybackMarker(hostname='node_k8s-he-services-qa_k8s-he-qa-121-f59ae0-master-0') SectionMarker(name=SectionName('kube_node_kubelet_v1'), cached=None, encoding='utf-8', nostrip=False, persist=None, separator='\x00') / Transition PiggybackSectionParser -> PiggybackSectionParser
PiggybackMarker(hostname='node_k8s-he-services-qa_k8s-he-qa-121-f59ae0-master-0') SectionMarker(name=SectionName('kube_pod_resources_v1'), cached=None, encoding='utf-8', nostrip=False, persist=None, separator='\x00') / Transition PiggybackSectionParser -> PiggybackSectionParser
PiggybackMarker(hostname='node_k8s-he-services-qa_k8s-he-qa-121-f59ae0-master-0') SectionMarker(name=SectionName('kube_allocatable_pods_v1'), cached=None, encoding='utf-8', nostrip=False, persist=None, separator='\x00') / Transition PiggybackSectionParser -> PiggybackSectionParser
PiggybackMarker(hostname='node_k8s-he-services-qa_k8s-he-qa-121-f59ae0-master-0') SectionMarker(name=SectionName('kube_node_info_v1'), cached=None, encoding='utf-8', nostrip=False, persist=None, separator='\x00') / Transition PiggybackSectionParser -> PiggybackSectionParser
PiggybackMarker(hostname='node_k8s-he-services-qa_k8s-he-qa-121-f59ae0-master-0') SectionMarker(name=SectionName('kube_cpu_resources_v1'), cached=None, encoding='utf-8', nostrip=False, persist=None, separator='\x00') / Transition PiggybackSectionParser -> PiggybackSectionParser
PiggybackMarker(hostname='node_k8s-he-services-qa_k8s-he-qa-121-f59ae0-master-0') SectionMarker(name=SectionName('kube_memory_resources_v1'), cached=None, encoding='utf-8', nostrip=False, persist=None, separator='\x00') / Transition PiggybackSectionParser -> PiggybackSectionParser
PiggybackMarker(hostname='node_k8s-he-services-qa_k8s-he-qa-121-f59ae0-master-0') SectionMarker(name=SectionName('kube_allocatable_cpu_resource_v1'), cached=None, encoding='utf-8', nostrip=False, persist=None, separator='\x00') / Transition PiggybackSectionParser -> PiggybackSectionParser
PiggybackMarker(hostname='node_k8s-he-services-qa_k8s-he-qa-121-f59ae0-master-0') SectionMarker(name=SectionName('kube_allocatable_memory_resource_v1'), cached=None, encoding='utf-8', nostrip=False, persist=None, separator='\x00') / Transition PiggybackSectionParser -> PiggybackSectionParser
PiggybackMarker(hostname='node_k8s-he-services-qa_k8s-he-qa-121-f59ae0-master-0') SectionMarker(name=SectionName('kube_node_conditions_v1'), cached=None, encoding='utf-8', nostrip=False, persist=None, separator='\x00') / Transition PiggybackSectionParser -> PiggybackSectionParser
PiggybackMarker(hostname='node_k8s-he-services-qa_k8s-he-qa-121-f59ae0-master-0') SectionMarker(name=SectionName('kube_node_custom_conditions_v1'), cached=None, encoding='utf-8', nostrip=False, persist=None, separator='\x00') / Transition PiggybackSectionParser -> PiggybackSectionParser
Transition PiggybackSectionParser -> NOOPParser
[...]
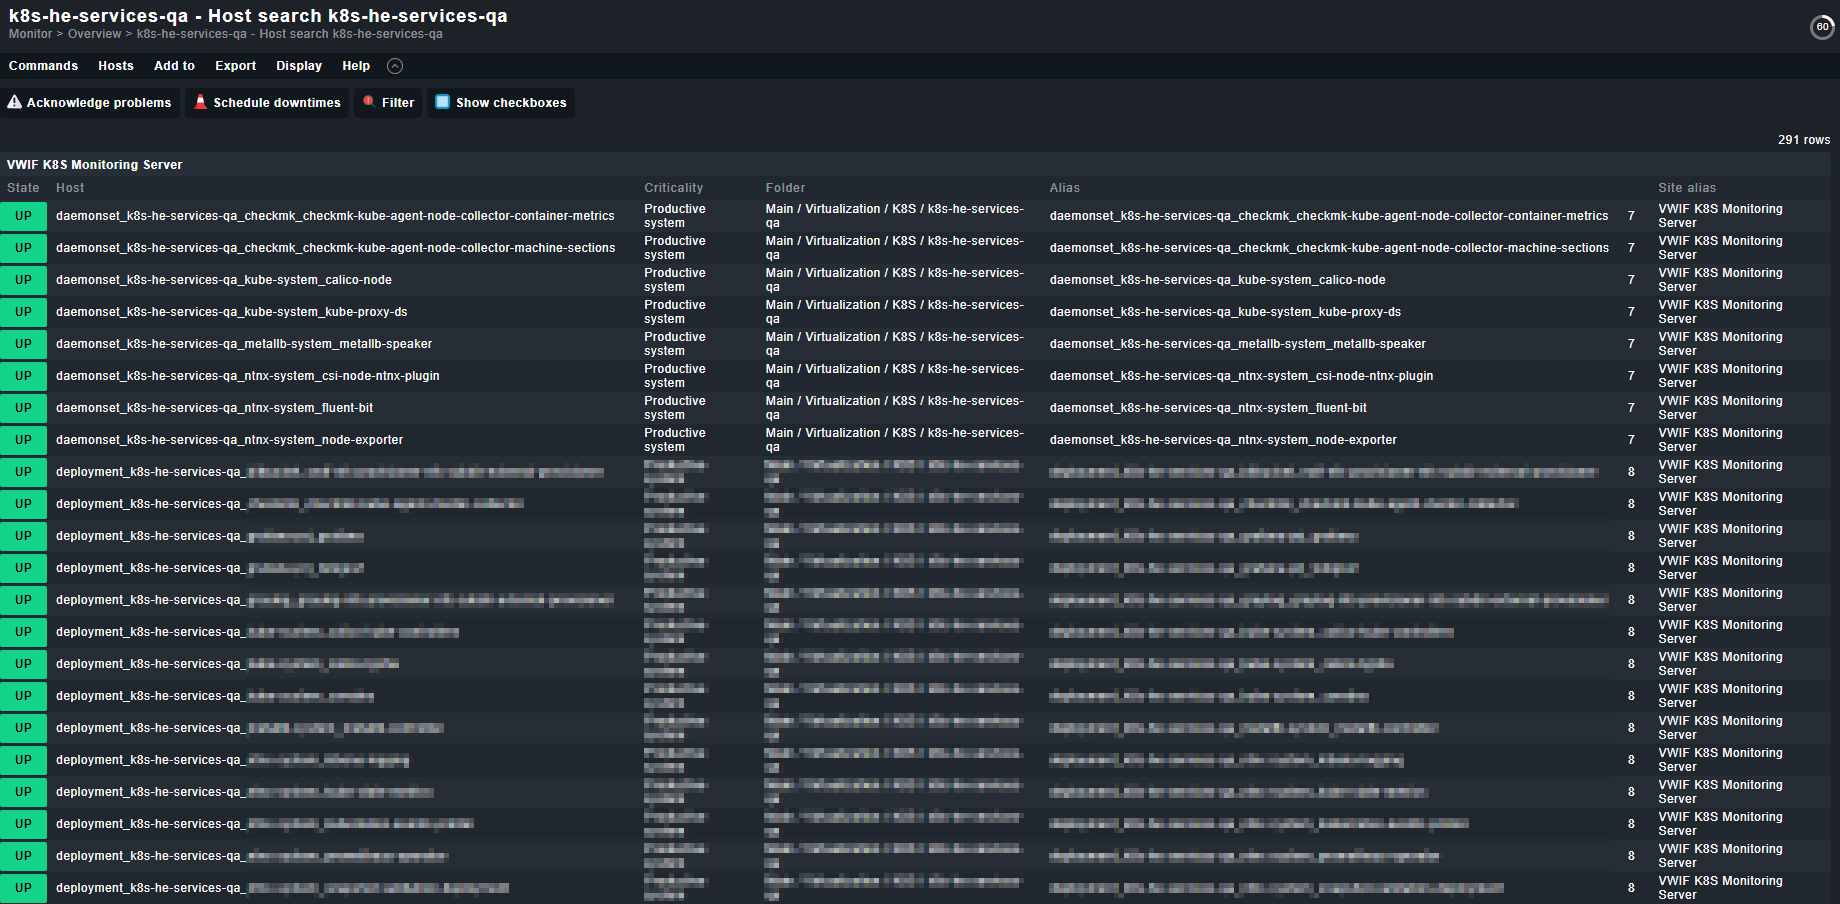
Received piggyback data for 291 hosts
[cpu_tracking] Start [7f0aa0e1e940]
value store: synchronizing
Trying to acquire lock on /omd/sites/sitename/tmp/check_mk/counters/k8s-he-services-qa
Got lock on /omd/sites/sitename/tmp/check_mk/counters/k8s-he-services-qa
value store: loading from disk
Releasing lock on /omd/sites/sitename/tmp/check_mk/counters/k8s-he-services-qa
Released lock on /omd/sites/sitename/tmp/check_mk/counters/k8s-he-services-qa
CPU resources Requests: 85.674 (242/302 containers with requests), Limits: 140.200 (219/302 containers with limits), Allocatable: 136.000
Cluster collector Cluster collector version: 1.4.0, Nodes with container collectors: 16/16, Nodes with machine collectors: 16/16, Container Metrics: No data, Machine Metrics: OK
Info Name: k8s-he-services-qa
Kubernetes API Live, Ready
Memory resources Requests: 160 GiB (226/302 containers with requests), Limits: 240 GiB (225/302 containers with limits), Allocatable: 248 GiB
Nodes Worker nodes 18/18, No control plane nodes found
Pod resources Running: 207, Pending: 0, Succeeded: 12, Failed: 0, Unknown: 0, Allocatable: 1980
No piggyback files for 'k8s-he-services-qa'. Skip processing.
[cpu_tracking] Stop [7f0aa0e1e940 - Snapshot(process=posix.times_result(user=0.010000000000000009, system=0.0, children_user=0.0, children_system=0.0, elapsed=0.009999999776482582))]
[special_kube] Success, execution time 3.0 sec | execution_time=2.960 user_time=0.030 system_time=0.020 children_user_time=2.230 children_system_time=0.210 cmk_time_ds=0.470 cmk_time_agent=0.000
Trying the API with curl:
/machine_sections work
# curl -k -H "Authorization: Bearer TOKEN" https://checkmk-kube-agent-service-fqdn/machine_sections | jq
  % Total    % Received % Xferd  Average Speed   Time    Time     Time  Current
                                 Dload  Upload   Total   Spent    Left  Speed
100  183k  100  183k    0     0  3747k      0 --:--:-- --:--:-- --:--:-- 3825k
[
  {
    "node_name": "k8s-he-qa-121-f59ae0-worker-1",
    "sections": "<<<check_mk>>>\nVersion: 2.1.0-latest\nAgentOS: kube 1.4.0\n<<<kernel>>>
	[...]
/container_metrics is empty
#   curl -k -H "Authorization: Bearer TOKEN" https://checkmk-kube-agent-service-fqdn/container_metrics | jq
  % Total    % Received % Xferd  Average Speed   Time    Time     Time  Current
                                 Dload  Upload   Total   Spent    Left  Speed
100     2  100     2    0     0     50      0 --:--:-- --:--:-- --:--:--    51
[]
#
checkmk-kube-agent-node-collector-container-metrics-5m58n.log
E0602 06:05:42.452838       1 manager.go:1123] Failed to create existing container: /kubepods.slice/kubepods-pod5ba9ec62_91c2_4528_afdb_bded7ccecd46.slice/docker-458e23e52f451decddce451635ec2ee18f95c69798964fec563b070fd8f9f455.scope: failed to identify the read-write layer ID for container "458e23e52f451decddce451635ec2ee18f95c69798964fec563b070fd8f9f455". - open /var/nutanix/docker/image/overlay2/layerdb/mounts/458e23e52f451decddce451635ec2ee18f95c69798964fec563b070fd8f9f455/mount-id: no such file or directory
E0602 06:05:42.453407       1 manager.go:1123] Failed to create existing container: /kubepods.slice/kubepods-pod3cf8dbf0_9880_486e_9e8d_345835721445.slice/docker-c70ea1354689fc99fc795c42635a8abf9bbf18d9d8cd6ee5f53228a00d789cdd.scope: failed to identify the read-write layer ID for container "c70ea1354689fc99fc795c42635a8abf9bbf18d9d8cd6ee5f53228a00d789cdd". - open /var/nutanix/docker/image/overlay2/layerdb/mounts/c70ea1354689fc99fc795c42635a8abf9bbf18d9d8cd6ee5f53228a00d789cdd/mount-id: no such file or directory
E0602 06:05:42.453843       1 manager.go:1123] Failed to create existing container: /kubepods.slice/kubepods-besteffort.slice/kubepods-besteffort-pod07aaf76f_7a20_4d33_b158_db44763507de.slice/docker-90980f0cdc979cd022aad8ff973c31727ba9572159d5ffd0981571ca2c95fd31.scope: failed to identify the read-write layer ID for container "90980f0cdc979cd022aad8ff973c31727ba9572159d5ffd0981571ca2c95fd31". - open /var/nutanix/docker/image/overlay2/layerdb/mounts/90980f0cdc979cd022aad8ff973c31727ba9572159d5ffd0981571ca2c95fd31/mount-id: no such file or directory
E0602 06:05:42.454557       1 manager.go:1123] Failed to create existing container: /kubepods.slice/kubepods-burstable.slice/kubepods-burstable-pod979b499a_3432_4065_bc40_04203ef4c43d.slice/docker-c61135ef5bf7d338e90543fc1afeb1bcaf18763e3d0c1a3b499a4465335287a0.scope: failed to identify the read-write layer ID for container "c61135ef5bf7d338e90543fc1afeb1bcaf18763e3d0c1a3b499a4465335287a0". - open /var/nutanix/docker/image/overlay2/layerdb/mounts/c61135ef5bf7d338e90543fc1afeb1bcaf18763e3d0c1a3b499a4465335287a0/mount-id: no such file or directory
E0602 06:05:42.455196       1 manager.go:1123] Failed to create existing container: /kubepods.slice/kubepods-burstable.slice/kubepods-burstable-podf058ff8e_bf9d_454c_8ecd_9ac293cdaeff.slice/docker-cbc2f8d3d762ffd5a5a4d9d3c04fff04c840aca48b49c3c27e0f8b1f940181b4.scope: failed to identify the read-write layer ID for container "cbc2f8d3d762ffd5a5a4d9d3c04fff04c840aca48b49c3c27e0f8b1f940181b4". - open /var/nutanix/docker/image/overlay2/layerdb/mounts/cbc2f8d3d762ffd5a5a4d9d3c04fff04c840aca48b49c3c27e0f8b1f940181b4/mount-id: no such file or directory
E0602 06:05:42.455676       1 manager.go:1123] Failed to create existing container: /kubepods.slice/kubepods-burstable.slice/kubepods-burstable-pod979b499a_3432_4065_bc40_04203ef4c43d.slice/docker-95b2bdd1ce3ed529734aa9c065e6d256b67b9927883d4a429bdb0e0f99dd6c10.scope: failed to identify the read-write layer ID for container "95b2bdd1ce3ed529734aa9c065e6d256b67b9927883d4a429bdb0e0f99dd6c10". - open /var/nutanix/docker/image/overlay2/layerdb/mounts/95b2bdd1ce3ed529734aa9c065e6d256b67b9927883d4a429bdb0e0f99dd6c10/mount-id: no such file or directory
E0602 06:05:42.456147       1 manager.go:1123] Failed to create existing container: /kubepods.slice/kubepods-burstable.slice/kubepods-burstable-poda6f531b1_f84f_49f3_bb55_0c6bfc285a23.slice/docker-c6c6e37689a4fcf59ef66c26246913c34ee60953da8ae2d044a3d8f5cf56b6ef.scope: failed to identify the read-write layer ID for container "c6c6e37689a4fcf59ef66c26246913c34ee60953da8ae2d044a3d8f5cf56b6ef". - open /var/nutanix/docker/image/overlay2/layerdb/mounts/c6c6e37689a4fcf59ef66c26246913c34ee60953da8ae2d044a3d8f5cf56b6ef/mount-id: no such file or directory
E0602 06:05:42.456811       1 manager.go:1123] Failed to create existing container: /kubepods.slice/kubepods-burstable.slice/kubepods-burstable-podc9643256_7b80_42e9_beb9_c22d6f63f6f9.slice/docker-9a1f906d92cdbdbc1d7a0b09318a8eb4bf51b24c541b2fb91504e65a373cb448.scope: failed to identify the read-write layer ID for container "9a1f906d92cdbdbc1d7a0b09318a8eb4bf51b24c541b2fb91504e65a373cb448". - open /var/nutanix/docker/image/overlay2/layerdb/mounts/9a1f906d92cdbdbc1d7a0b09318a8eb4bf51b24c541b2fb91504e65a373cb448/mount-id: no such file or directory
E0602 06:05:42.457417       1 manager.go:1123] Failed to create existing container: /kubepods.slice/kubepods-besteffort.slice/kubepods-besteffort-pod07aaf76f_7a20_4d33_b158_db44763507de.slice/docker-aedfafdd30874682f847af47b1429ad897775b6fe25d797ccd47ba19d341762e.scope: failed to identify the read-write layer ID for container "aedfafdd30874682f847af47b1429ad897775b6fe25d797ccd47ba19d341762e". - open /var/nutanix/docker/image/overlay2/layerdb/mounts/aedfafdd30874682f847af47b1429ad897775b6fe25d797ccd47ba19d341762e/mount-id: no such file or directory
E0602 06:05:42.458164       1 manager.go:1123] Failed to create existing container: /kubepods.slice/kubepods-burstable.slice/kubepods-burstable-podf058ff8e_bf9d_454c_8ecd_9ac293cdaeff.slice/docker-8ecf305f38c24595f51788abb51166a3f81a24de35eeeaee76c0259bec801eb0.scope: failed to identify the read-write layer ID for container "8ecf305f38c24595f51788abb51166a3f81a24de35eeeaee76c0259bec801eb0". - open /var/nutanix/docker/image/overlay2/layerdb/mounts/8ecf305f38c24595f51788abb51166a3f81a24de35eeeaee76c0259bec801eb0/mount-id: no such file or directory
E0602 06:05:42.458744       1 manager.go:1123] Failed to create existing container: /kubepods.slice/kubepods-burstable.slice/kubepods-burstable-pod368af66c_749d_4d90_a34b_7ea5b0d9ef9f.slice/docker-affd6d5994d109898201b6566a797f165c87b7e1b79d1e89d32a623115878a25.scope: failed to identify the read-write layer ID for container "affd6d5994d109898201b6566a797f165c87b7e1b79d1e89d32a623115878a25". - open /var/nutanix/docker/image/overlay2/layerdb/mounts/affd6d5994d109898201b6566a797f165c87b7e1b79d1e89d32a623115878a25/mount-id: no such file or directory
E0602 06:05:42.465280       1 manager.go:1123] Failed to create existing container: /kubepods.slice/kubepods-burstable.slice/kubepods-burstable-pod368af66c_749d_4d90_a34b_7ea5b0d9ef9f.slice/docker-4e1a042075120ff0906cb3d8ff687ef5593f3643c3afede5d90b58c8c575ee7b.scope: failed to identify the read-write layer ID for container "4e1a042075120ff0906cb3d8ff687ef5593f3643c3afede5d90b58c8c575ee7b". - open /var/nutanix/docker/image/overlay2/layerdb/mounts/4e1a042075120ff0906cb3d8ff687ef5593f3643c3afede5d90b58c8c575ee7b/mount-id: no such file or directory
E0602 06:05:42.465943       1 manager.go:1123] Failed to create existing container: /kubepods.slice/kubepods-podfd41f077_c341_467d_be96_c4fd846a2fb0.slice/docker-24f35c3b9784947bfedf5c5aca6666deecaeb547701453b093d9583ecb492381.scope: failed to identify the read-write layer ID for container "24f35c3b9784947bfedf5c5aca6666deecaeb547701453b093d9583ecb492381". - open /var/nutanix/docker/image/overlay2/layerdb/mounts/24f35c3b9784947bfedf5c5aca6666deecaeb547701453b093d9583ecb492381/mount-id: no such file or directory