Hey Ronald,
if you want detailed support/troubleshooting, please contact a Checkmk partner or our support.
This is still a community support forum and I have limited time to help here and only do this is my free time in breaks or after work.
The problem you have has nothing to do with the configuration on Checkmk side. That is fine.
The problem you are encountering is that the container metrics are not collected.
We guarantee that this works for Vanilla Kubernetes, Google Kubernetes Engine (not Autopilot, which is handling GKE differently!), AWS Elastic Kubernetes Engine, Azure Kubernetes Service and OpenShift.
For Rancher, there are some slight changes you need to do, due to a different location of containerd on the nodes in that distro. On VMware Tanzu, it should work off-the-shelf as well.
However, regarding Kubernetes, there is a plethora of versions and distributions and setups, which all behave differently. There is a common misunderstanding that Kubernetes = Kubernetes.
Therefore, as asked before, I need to understand which Kubernetes you are using.
Are you using a managed service, have you set it up yourself from the scratch, are you using an enterprise distro of Kubernetes?
And then, which version are you using? Which container runtime?
How do you find that out?
This screenshot is a good indicator:
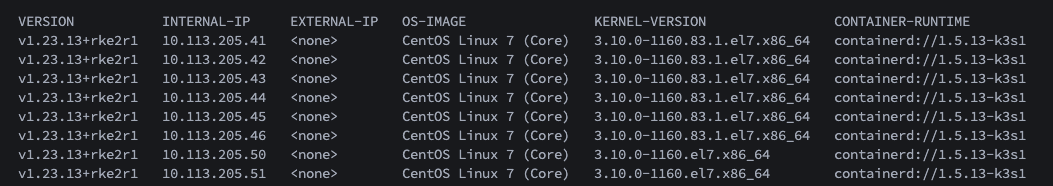
Your nodes are using RKE2. Which is good, because then we can make it work. I am a bit worried, because it could also be that you are using k3s - let’s hope not.
The solution to your problem can be found here: Kubernetes Cluster collector doesn't show CPU, memory usage or container metrics - #10 by chauhan_sudhir
We have Rancher support on our roadmap for Checkmk 2.3, which includes building in that change.
Please keep in mind that Rancher had a major bug recently, which relabeled all metrics internally, so that any monitoring system couldn’t work with it anymore. Thus, best to have it up-to-date.