Hi ,
I have followed the Video Tutorial regarding “Monitoring Kubernetes”, I I have setup everything like in the video, connection is working however I’m not seeing , CPU - Memory Metrics
I have the same issue. I installed the Kubernetes Monitoring Agent into an GCP GKE Autopilot cluster. I am missing the usage metrics on CPU and Memory for every pod / deployment and so on. I only see the request and limit values for the pods. Does anyone know a possible solution?
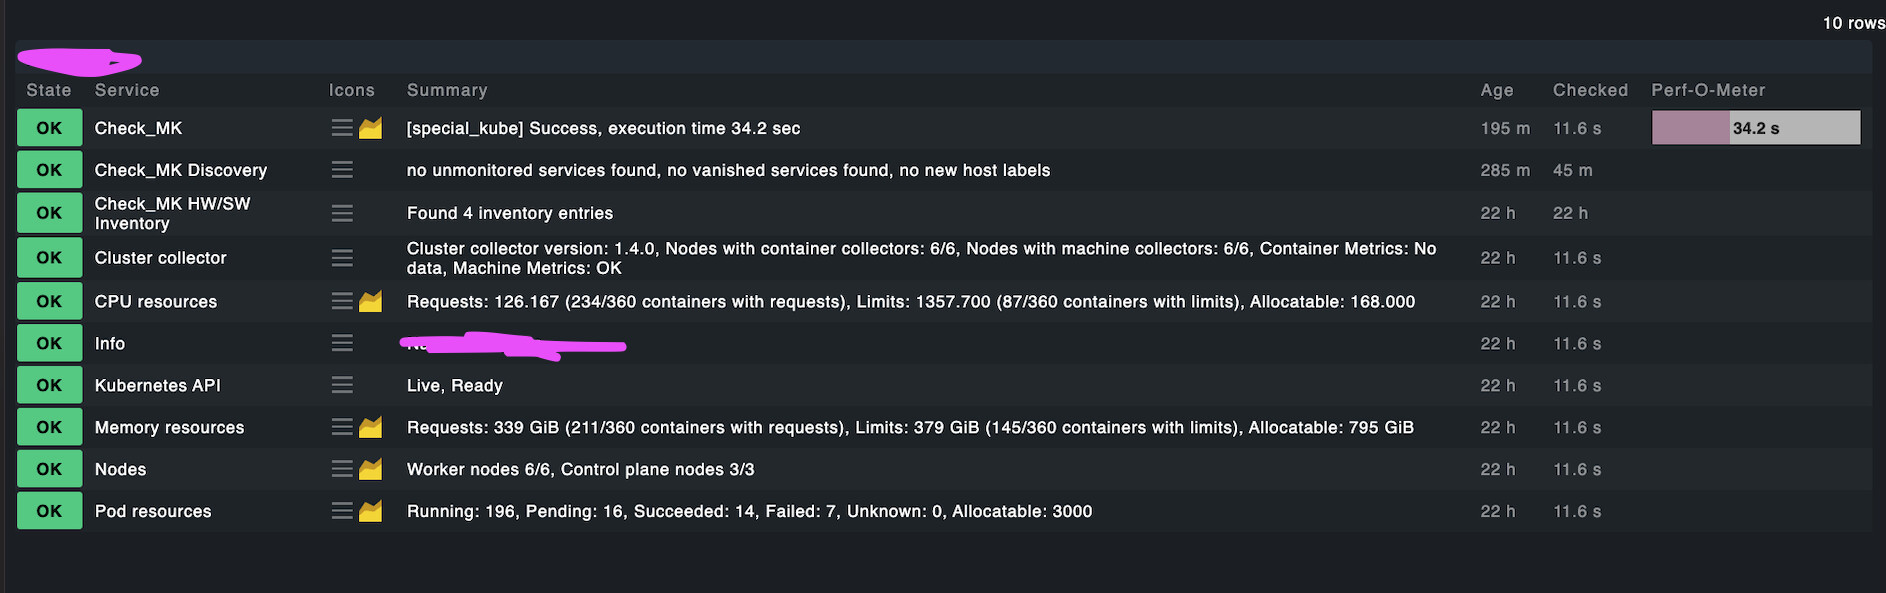
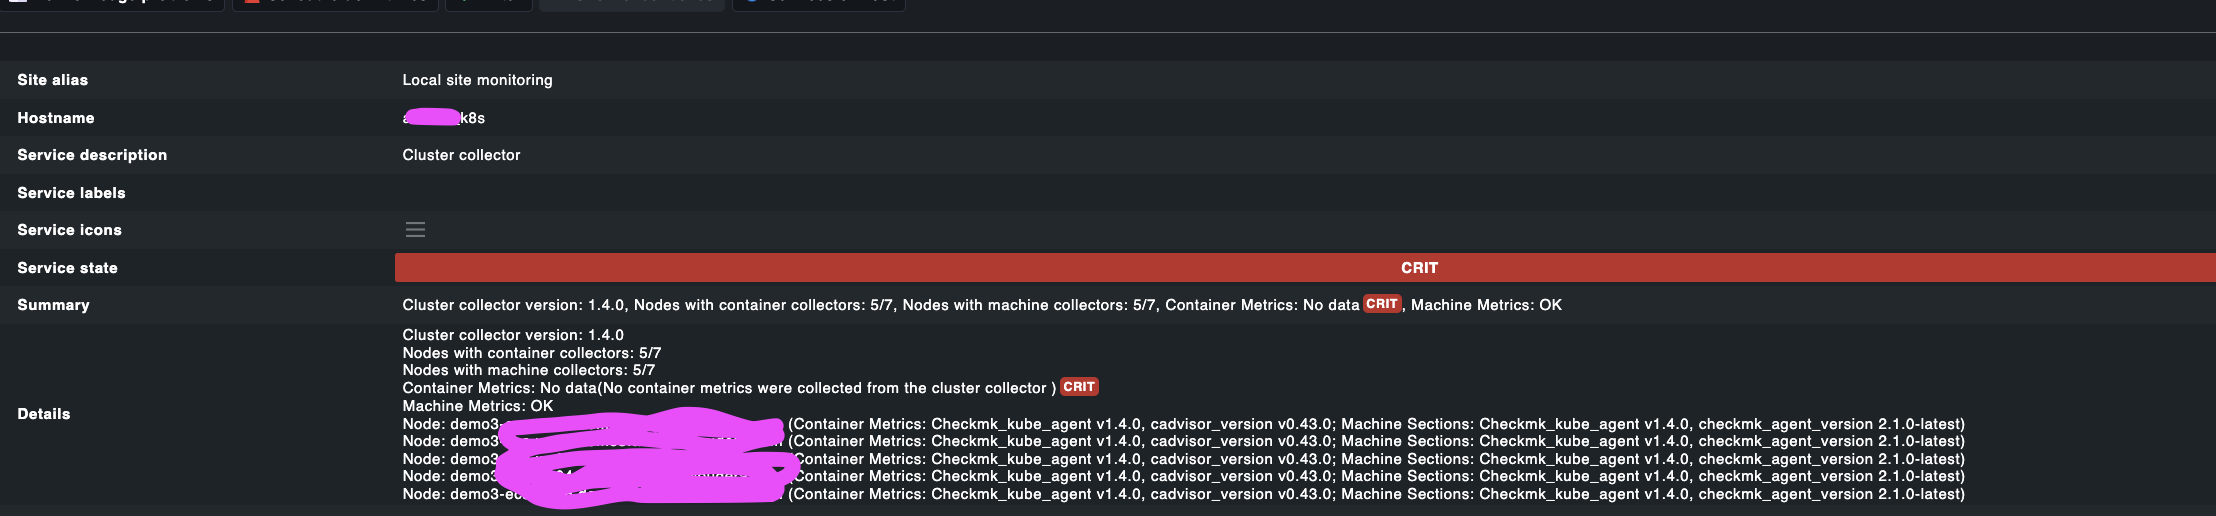
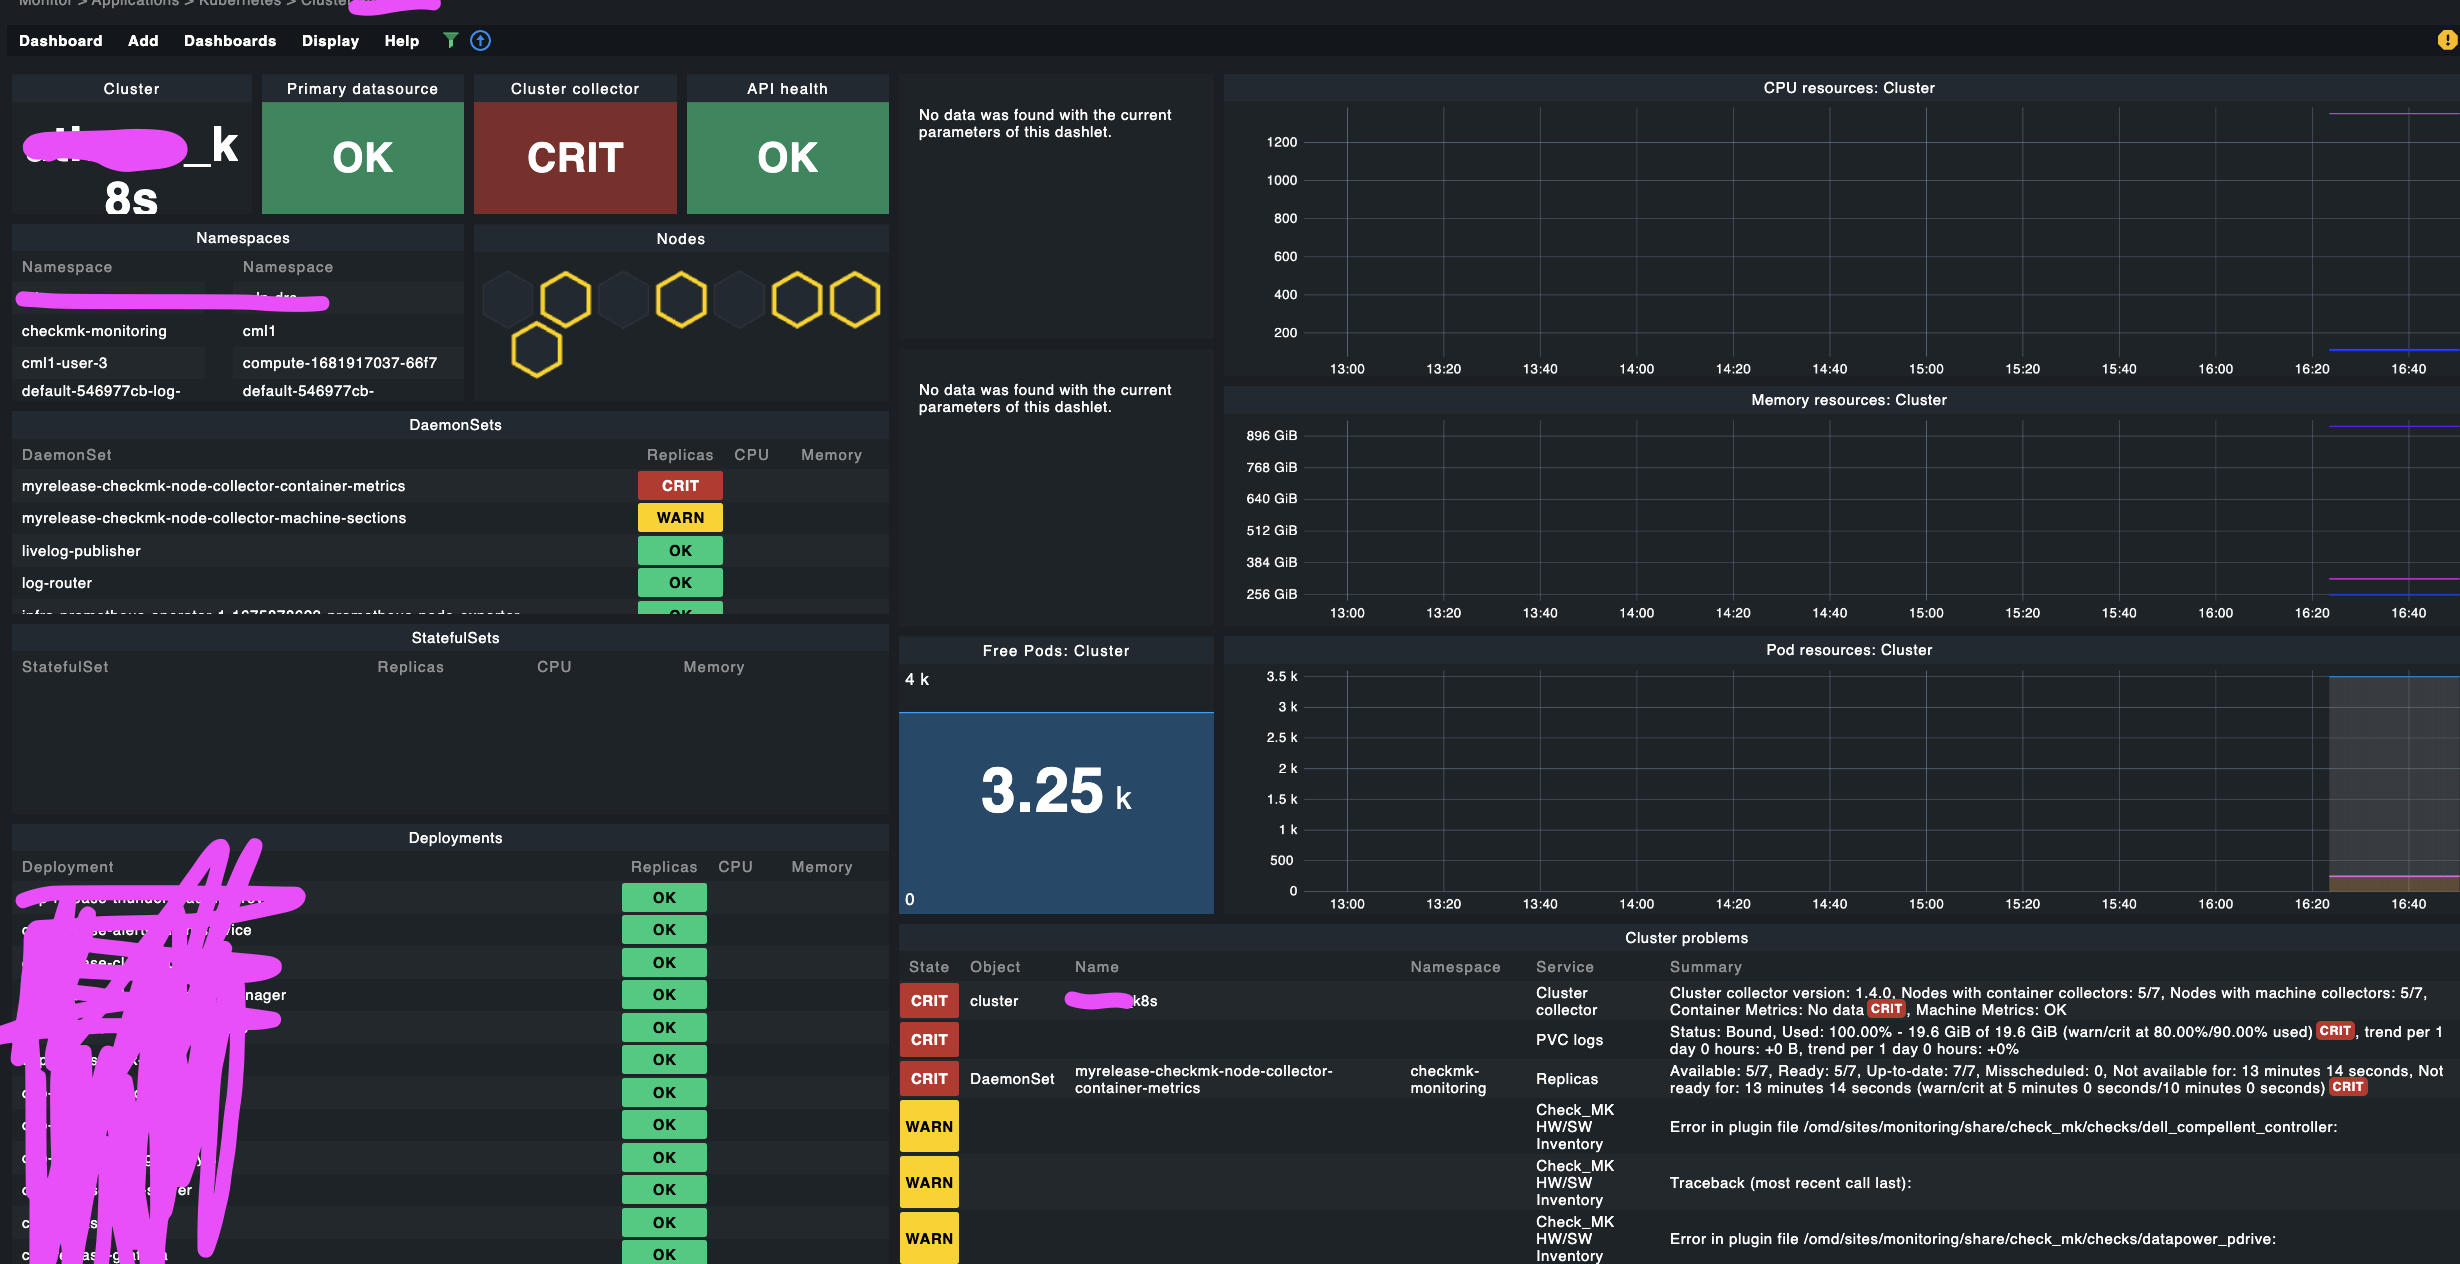
what I can see from here, is that the Cluster Collector service informs us, that the cluster collector is properly deployed, and we can also see information on Machine Metrics being delivered. That also means, it is properly installed.
However, there are no Container Metrics send. Therefore, we don’t see any metrics on the containers.
This typically means, that the cAdvisor, which we are using is not being able to collect any metrics.
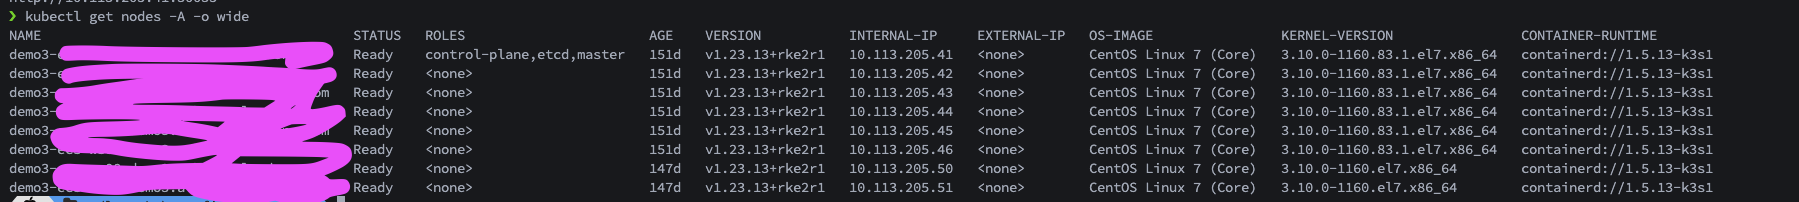
Can you please share with us the output of kubectl get nodes -o wide
This way, we can see which container runtime is running on the nodes.
And, I need the information which Kubernetes distro and version you are using.
Kubernetes != Kubernetes and the differences are quite big between different K8s flavours and implementations.
Your problem might be very different. There are often many different sources. Therefore, please create a thread yourself or even better contact the Checkmk support.
If anyone of you needs timely support, please create a ticket. This is a community support forum. I only typically answer, if it is related to a new problem, which we need to investigate then ourselves.
@SvenKt is working with me. Information on our test-cluster:
kubectl get nodes -o wide
NAME                                           STATUS   ROLES    AGE    VERSION            INTERNAL-IP   EXTERNAL-IP   OS-IMAGE                             KERNEL-VERSION   CONTAINER-RUNTIME
gk3-test-apc-priv-default-pool-0e9dd36c-zhco   Ready    <none>   6d6h   v1.25.8-gke.1000   10.156.0.8    <none>        Container-Optimized OS from Google   5.15.89+         containerd://1.6.18
gk3-test-apc-priv-default-pool-db515e1b-qwjn   Ready    <none>   6d6h   v1.25.8-gke.1000   10.156.0.9    <none>        Container-Optimized OS from Google   5.15.89+         containerd://1.6.18
gk3-test-apc-priv-pool-1-eab79ec1-ovbx         Ready    <none>   6d4h   v1.25.8-gke.1000   10.156.0.10   <none>        Container-Optimized OS from Google   5.15.89+         containerd://1.6.18
But to be clear @martin.hirschvogel checkMK should report used-metrics as well? Not only requests and limits?
Also to narrow it down: is there a differentiation between, memory used, memory allocated, memory requested (k8s), memory limit (k8s)?
How could we debug missing metrics from our side, as - like you pointed out - there a many different setups. This could also lead to a wider support by checkMK if we (the users) could provide better error-reports.
Yes, Checkmk should report used metrics as well, e.g. how much CPU and Memory is actually used and how that relates to the requests and limits to e.g. detect OOM and CPU throttling.
All of the metrics mentioned by you should be included.
If not, then there is an issue, which we would have to take a look into.
One issue might be around how Auto Pilot creates and restricts Kubernetes clusters, which is apparently different to Google Kubernetes Engine.
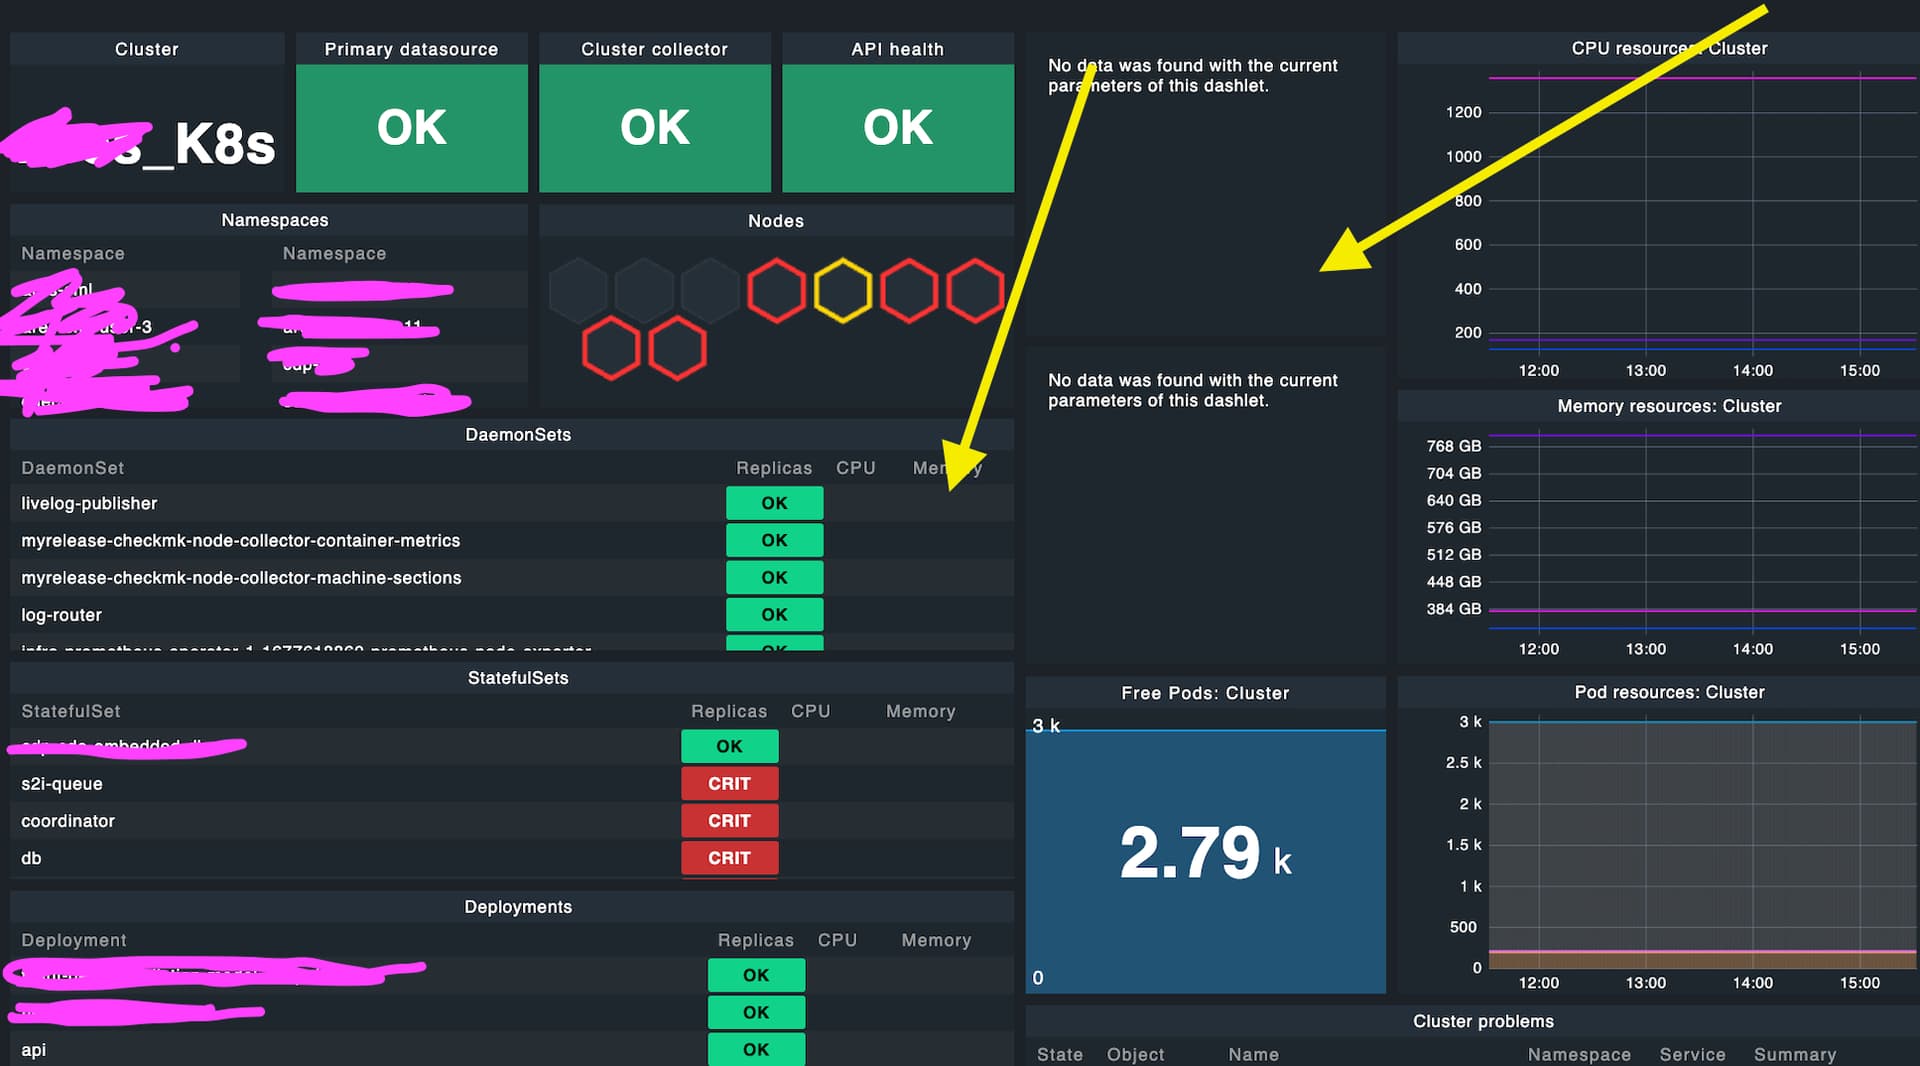
If the metrics are not there, then look at the Cluster Collector what is says (e.g. no container metrics).
If this is the case, look at the log of the cadvisor container inside the node-collector-container-metrics.
Whatever is provided in there, helps us to understand what the issue is.
Hello @martin.hirschvogel, the cluster collector does not output any error messages.
When I check the logs of this pod I just get a bunch of these lines:
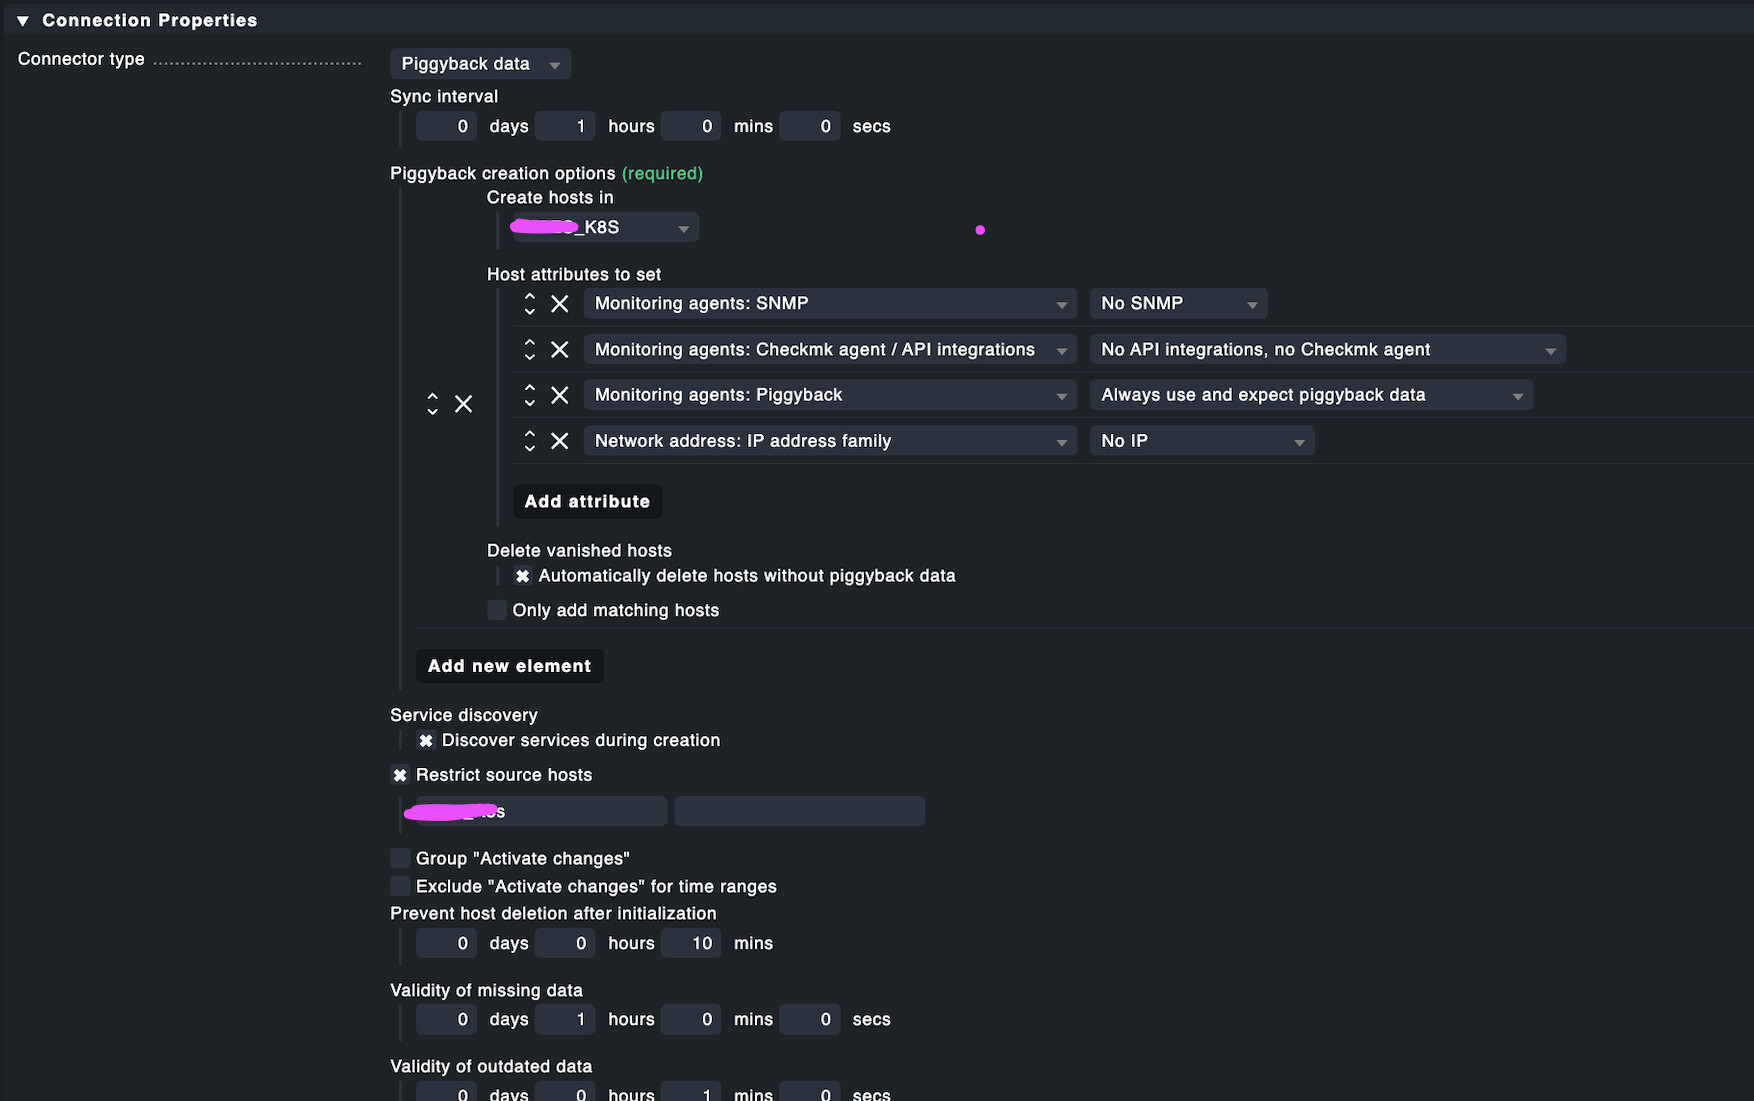
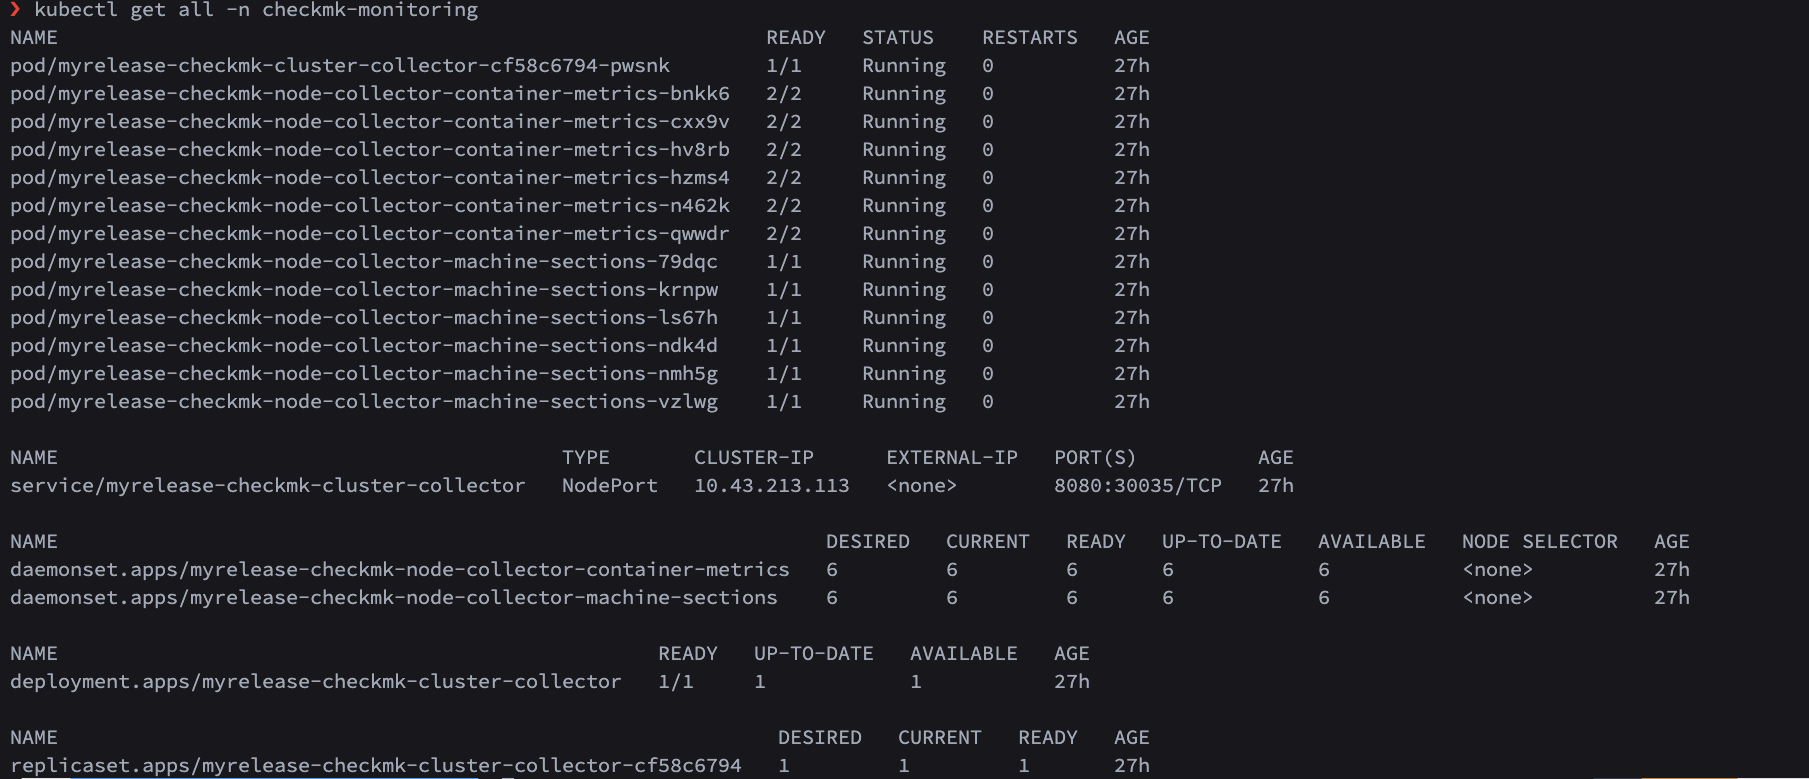
Regarding the node-collector-container-metrics there is no such daemonset in our cluster. I installed the helm chart according to the documentation Kubernetes überwachen . I just checked the actual deployed resources against the helm chart’s manifest. So the container-metrics daemonset hasn’t been deployed and “helm list” shows a status “failed” with no further information why.
I ran the deployment of the helm chart again with --debug to catch the error messages and got the following:
Error: 1 error occurred:
* admission webhook “gkepolicy.common-webhooks.networking.gke.io” denied the request: GKE Warden rejected the request because it violates one or more constraints.
Violations details: {“[denied by autogke-no-write-mode-hostpath]”:[“hostPath volume var-run in container cadvisor is accessed in write mode; disallowed in Autopilot.”,“hostPath volume sys used in container cadvisor uses path /sys which is not allowed in Autopilot. Allowed path prefixes for hostPath volumes are: [/var/log/].”,“hostPath volume docker used in container cadvisor uses path /var/lib/docker which is not allowed in Autopilot. Allowed path prefixes for hostPath volumes are: [/var/log/].”]}
helm.go:84: [debug] 1 error occurred:
* admission webhook “gkepolicy.common-webhooks.networking.gke.io” denied the request: GKE Warden rejected the request because it violates one or more constraints.
Violations details: {“[denied by autogke-no-write-mode-hostpath]”:[“hostPath volume var-run in container cadvisor is accessed in write mode; disallowed in Autopilot.”,“hostPath volume sys used in container cadvisor uses path /sys which is not allowed in Autopilot. Allowed path prefixes for hostPath volumes are: [/var/log/].”,“hostPath volume docker used in container cadvisor uses path /var/lib/docker which is not allowed in Autopilot. Allowed path prefixes for hostPath volumes are: [/var/log/].”]}
Yes, because I believe Google allows them to run privileged containers in AutoPilot.
Also, not all of their functionality is available as eBPF is not possible there, which is a pillar for their monitoring.
I could be wrong, but isn’t their approach to use prometheus? Of course this raises the question on how prometheus is collecting the metric, but prometheus is also available without an own deployment, this could be a source today and an alternative to kindly ask google to be set on an allow-list.
I doubt it. They use the DD agent from what it looks like in the Helm chart.
Do you have a Prometheus running in AutoPilot? If so, which way did you use to deploy it?
Because if a Prometheus is set up in a certain way (basically identically how Prometheus is setup in OpenShift by RedHat), then we can also use it for monitoring Kubernetes clusters.
As to if we are already using prometheus in our cluster: NO - but my idea was that you add it to your setup for monitoring GKE autopilot in a minimal needed configuration as a workaround in GKE autopilot.
Any clues how I might further debug my situation, seems like where ever I add K8s Monitoring via Node Collector I was never able to see CPU/Memory metrics.