Hi @kribbit ,
at first I didn’t understand your code, but it gave me very good hint and then I search in check_mk files. Found /opt/omd/versions/1.6.0p11.cee/lib/python/cmk/gui/plugins/metrics/check_mk.py with all metric and graph definitions. I got it work almost perfectly. I can now produce combined graph with warn/crit values.
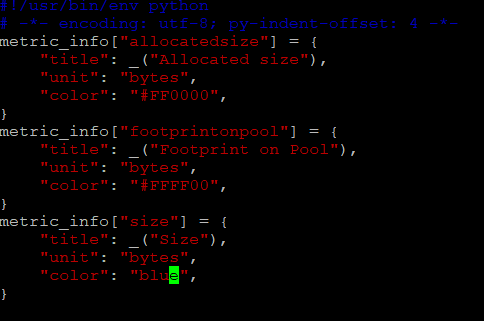
This is my custom metric file lokal.py in /omd/sites/otcsite16/local/share/check_mk/web/plugins/metrics
#!/usr/bin/env python
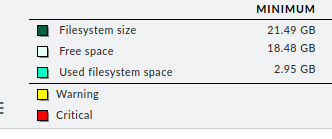
metric_info["totalused"] = {
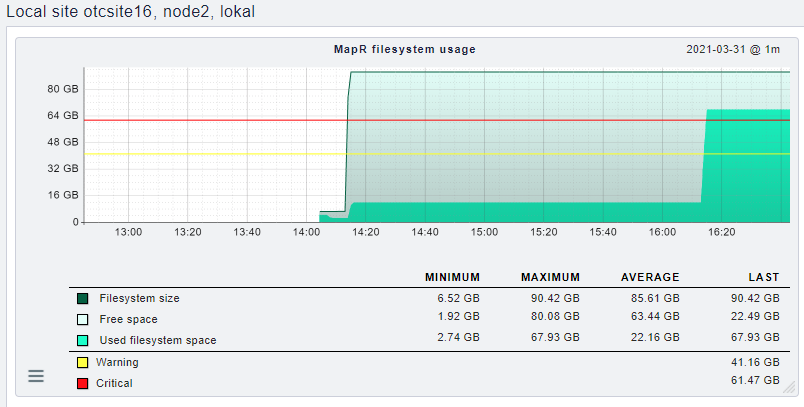
"title": _("Used filesystem space"),
"unit": "bytes",
"color": "#00ffc6",
}
metric_info["totalsize"] = {
"title": _("Filesystem size"),
"unit": "bytes",
"color": "#006040",
}
metric_info["totalfree"] = {
"title": _("Free space"),
"unit": "bytes",
"color": "#e3fff9",
}
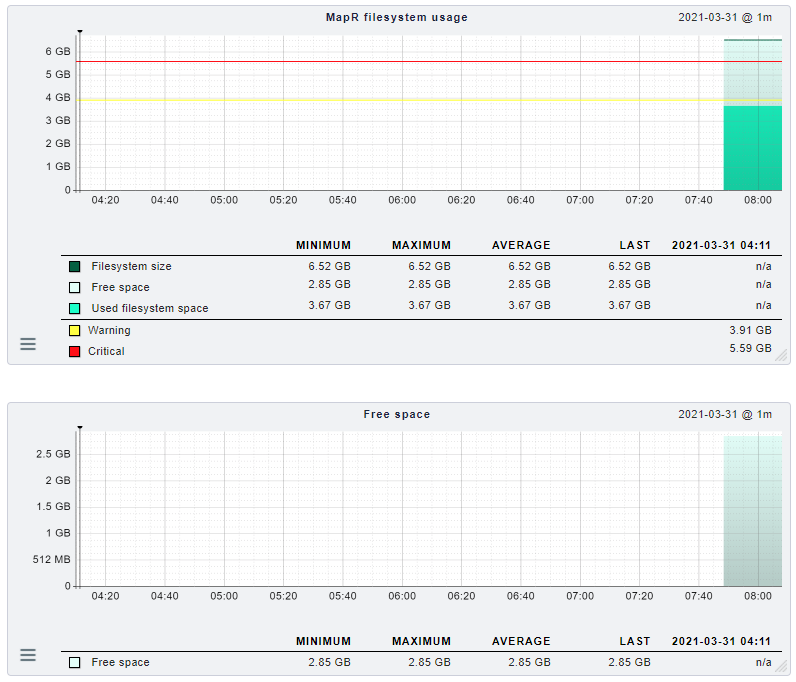
graph_info["totalused"] = {
"title": _("MapR filesystem usage"),
"metrics": [
("totalused", "area"),
("totalsize,totalused,-#e3fff9", "stack", _("Free space")),
("totalsize", "line"),
],
# scalars -> show warn/crit values in graph for item send by agent custom check
"scalars": [
"totalused:warn",
"totalused:crit",
],
"range": (0, "totalused:max"),
# I thought this is needed to hide second graph which is created because of stacking with 'totalsize'
"conflicting_metrics": ["totalfree"],
}
Simple script which is sending data from agent:
#!/bin/bash

# = GB
used=3938938509
size=7000000000
free=$(( $size-$used ))
warn=4200000000
crit=6000000000

echo "0 lokal totalused=${used};${warn};${crit}|totalsize=${size}|totalfree=${free} Dumb output"
exit 0
Problem with this is, that separated graph Free space is still shown and I don’t understand why.