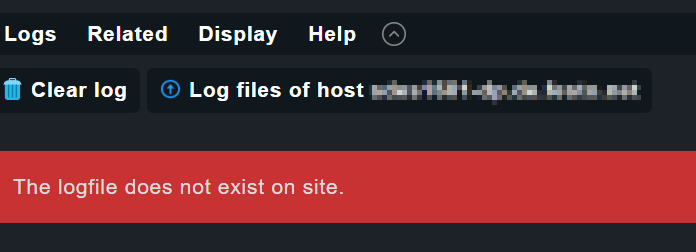
Disclaimer, I’m new to checkmk and still testing it. This week I updates from 2.1.0p1.cfe to 2.1.0p16.cfe. Everything looked ok, but then I noticed that logwatch check was not working anymore. Also “Try Pattern Match” does not return anything for any pattern on any host.
I found some messages about missing monitoring data issues, but nothing related to logwatch.
I then removed /var/check_mk/precompiled_checks and run cmk -R. No change. I removed the logwatch check, baked the agents again, installed them, added the rule again, baked/installed agents again, rescanned the host. Still the same error.
I get the feeling that something very basic is either missing or I’m doing something wrong.
Also something that I not fully understand yet. There is:
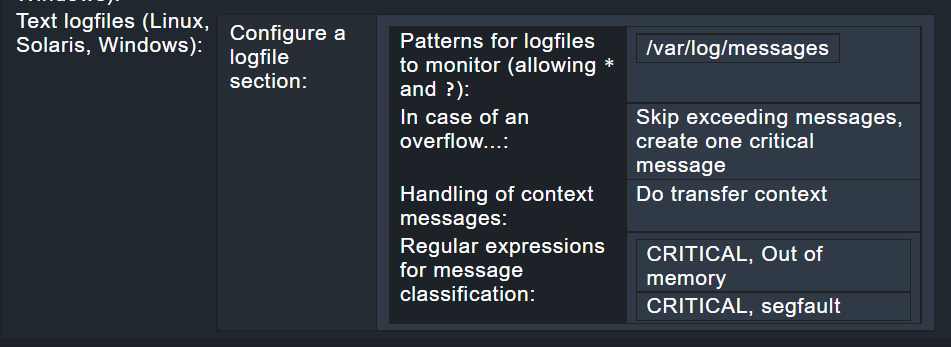
Setup → Services → Service monitoring rules → Logfile patterns
This is where I have now created a rule. In Setup → Agents → Windows, Linux, Solaris, AIX there is now only the vanilla agent to download. Before that I had a rule in Agents → “Agent Rules” and a dedicated agent to download for the hosts I had added this check to.
So what is the difference of adding a log check rule at those 2 locations?
Locally run agent
<<<logwatch>>>
[[[/var/log/messages]]]
BATCH: 1668767647-016227047014253124064114018134045065201032194243
[[[/var/log/messages]]]
BATCH: 1668767595-254176165141189098151046004093222083016005203111
[[[/var/log/messages]]]
BATCH: 1668767641-019202000130090102035197111207131020225054244173
~$ find . -name *logwatch*
./var/check_mk/logwatch
./.version_meta/skel/var/check_mk/logwatch
OMD[backup_team]:~$ ls -la ./var/check_mk/logwatch/
total 32
drwxrwxr-x  8 backup_team backup_team 4096 Jun  9 13:20 ./
drwxr-xr-x 25 backup_team backup_team 4096 Nov 18 10:06 ../
drwxrwx---  2 backup_team backup_team 4096 Nov 15 11:49 sdes1601-dp/
drwxrwx---  2 backup_team backup_team 4096 Nov 15 14:59 sdes1602-dp/
drwxrwx---  2 backup_team backup_team 4096 Nov 15 16:08 sdes1603-dp/
drwxrwx---  2 backup_team backup_team 4096 Nov 15 11:48 sdes1701-dp/
drwxrwx---  2 backup_team backup_team 4096 Nov 15 16:10 sdes1702-dp/
drwxrwx---  2 backup_team backup_team 4096 Nov 15 14:56 sdes1703-dp/
OMD[backup_team]:~$ ls -l ./.version_meta/skel/var/check_mk/logwatch
total 0
**CMK version: 2.1.0p16.cfe**
**OS version: Debian 11.5**

**Error message: Check plugin received no monitoring data**

**Output of “cmk --debug -vvn hostname”:** (If it is a problem with checks or plugins)

$ cmk --debug -vvn sdes1701-dp.xxxx
Checkmk version 2.1.0p16
Try license usage history update.
Trying to acquire lock on /omd/sites/backup_team/var/check_mk/license_usage/next_run
Got lock on /omd/sites/backup_team/var/check_mk/license_usage/next_run
Trying to acquire lock on /omd/sites/backup_team/var/check_mk/license_usage/history.json
Got lock on /omd/sites/backup_team/var/check_mk/license_usage/history.json
Next run time has not been reached yet. Abort.
Releasing lock on /omd/sites/backup_team/var/check_mk/license_usage/history.json
Released lock on /omd/sites/backup_team/var/check_mk/license_usage/history.json
Releasing lock on /omd/sites/backup_team/var/check_mk/license_usage/next_run
Released lock on /omd/sites/backup_team/var/check_mk/license_usage/next_run
+ FETCHING DATA
  Source: SourceType.HOST/FetcherType.TCP
[cpu_tracking] Start [7fb78f16f190]
[TCPFetcher] Fetch with cache settings: DefaultAgentFileCache(sdes1701-dp.xxxx, base_path=/omd/sites/backup_team/tmp/check_mk/cache, max_age=MaxAge(checking=0, discovery=120, inventory=120), disabled=False, use_outdated=False, simulation=False)
Not using cache (Too old. Age is 13 sec, allowed is 0 sec)
[TCPFetcher] Execute data source
Connecting via TCP to 10.24.56.231:6556 (5.0s timeout)
Detected transport protocol: TransportProtocol.PLAIN (b'<<')
Reading data from agent
Write data to cache file /omd/sites/backup_team/tmp/check_mk/cache/sdes1701-dp.xxxx
Trying to acquire lock on /omd/sites/backup_team/tmp/check_mk/cache/sdes1701-dp.xxxx
Got lock on /omd/sites/backup_team/tmp/check_mk/cache/sdes1701-dp.xxxx
Releasing lock on /omd/sites/backup_team/tmp/check_mk/cache/sdes1701-dp.xxxx
Released lock on /omd/sites/backup_team/tmp/check_mk/cache/sdes1701-dp.xxxx
Closing TCP connection to 10.24.56.231:6556
[cpu_tracking] Stop [7fb78f16f190 - Snapshot(process=posix.times_result(user=0.0, system=0.010000000000000009, children_user=0.0, children_system=0.0, elapsed=1.719999998807907))]
  Source: SourceType.HOST/FetcherType.PIGGYBACK
[cpu_tracking] Start [7fb78f16f580]
[PiggybackFetcher] Fetch with cache settings: NoCache(sdes1701-dp.xxxx, base_path=/omd/sites/backup_team/tmp/check_mk/data_source_cache/piggyback, max_age=MaxAge(checking=0, discovery=120, inventory=120), disabled=True, use_outdated=False, simulation=False)
Not using cache (Cache usage disabled)
[PiggybackFetcher] Execute data source
No piggyback files for 'sdes1701-dp.xxxx'. Skip processing.
No piggyback files for '10.24.56.231'. Skip processing.
Not using cache (Cache usage disabled)
[cpu_tracking] Stop [7fb78f16f580 - Snapshot(process=posix.times_result(user=0.0, system=0.0, children_user=0.0, children_system=0.0, elapsed=0.0))]
+ PARSE FETCHER RESULTS
  Source: SourceType.HOST/FetcherType.TCP
<<<check_mk>>> / Transition NOOPParser -> HostSectionParser
<<<cmk_agent_ctl_status:sep(0)>>> / Transition HostSectionParser -> HostSectionParser
<<<checkmk_agent_plugins_lnx:sep(0)>>> / Transition HostSectionParser -> HostSectionParser
<<<labels:sep(0)>>> / Transition HostSectionParser -> HostSectionParser
<<<df>>> / Transition HostSectionParser -> HostSectionParser
<<<df>>> / Transition HostSectionParser -> HostSectionParser
<<<systemd_units>>> / Transition HostSectionParser -> HostSectionParser
<<<nfsmounts>>> / Transition HostSectionParser -> HostSectionParser
<<<cifsmounts>>> / Transition HostSectionParser -> HostSectionParser
<<<mounts>>> / Transition HostSectionParser -> HostSectionParser
<<<ps_lnx>>> / Transition HostSectionParser -> HostSectionParser
<<<mem>>> / Transition HostSectionParser -> HostSectionParser
<<<cpu>>> / Transition HostSectionParser -> HostSectionParser
<<<uptime>>> / Transition HostSectionParser -> HostSectionParser
<<<lnx_if>>> / Transition HostSectionParser -> HostSectionParser
<<<lnx_if:sep(58)>>> / Transition HostSectionParser -> HostSectionParser
<<<lnx_bonding:sep(58)>>> / Transition HostSectionParser -> HostSectionParser
<<<ovs_bonding:sep(58)>>> / Transition HostSectionParser -> HostSectionParser
<<<tcp_conn_stats>>> / Transition HostSectionParser -> HostSectionParser
<<<multipath>>> / Transition HostSectionParser -> HostSectionParser
<<<diskstat>>> / Transition HostSectionParser -> HostSectionParser
<<<kernel>>> / Transition HostSectionParser -> HostSectionParser
<<<md>>> / Transition HostSectionParser -> HostSectionParser
<<<vbox_guest>>> / Transition HostSectionParser -> HostSectionParser
<<<postfix_mailq>>> / Transition HostSectionParser -> HostSectionParser
<<<postfix_mailq_status:sep(58)>>> / Transition HostSectionParser -> HostSectionParser
<<<job>>> / Transition HostSectionParser -> HostSectionParser
<<<chrony:cached(1668762622,30)>>> / Transition HostSectionParser -> HostSectionParser
<<<ipmi:cached(1668762624,300):sep(124)>>> / Transition HostSectionParser -> HostSectionParser
<<<ipmi_discrete:cached(1668762374,300):sep(124)>>> / Transition HostSectionParser -> HostSectionParser
<<<local:sep(0)>>> / Transition HostSectionParser -> HostSectionParser
No persisted sections
  -> Add sections: ['check_mk', 'checkmk_agent_plugins_lnx', 'chrony', 'cifsmounts', 'cmk_agent_ctl_status', 'cpu', 'df', 'diskstat', 'ipmi', 'ipmi_discrete', 'job', 'kernel', 'labels', 'lnx_bonding', 'lnx_if', 'local', 'md', 'mem', 'mounts', 'multipath', 'nfsmounts', 'ovs_bonding', 'postfix_mailq', 'postfix_mailq_status', 'ps_lnx', 'systemd_units', 'tcp_conn_stats', 'uptime', 'vbox_guest']
  Source: SourceType.HOST/FetcherType.PIGGYBACK
No persisted sections
  -> Add sections: []
Received no piggyback data
Received no piggyback data
[cpu_tracking] Start [7fb78f16fee0]
value store: synchronizing
Trying to acquire lock on /omd/sites/backup_team/tmp/check_mk/counters/sdes1701-dp.xxxx
Got lock on /omd/sites/backup_team/tmp/check_mk/counters/sdes1701-dp.xxxx
value store: loading from disk
Releasing lock on /omd/sites/backup_team/tmp/check_mk/counters/sdes1701-dp.xxxx
Released lock on /omd/sites/backup_team/tmp/check_mk/counters/sdes1701-dp.xxxx
Bonding Interface bond1 Status: up, Mode: IEEE 802.3ad Dynamic link aggregation, enpsf3/88:E9:A4:5E:35:34 up, enpsf5/88:E9:A4:5E:E4:14 up
Bonding Interface bond2 Status: up, Mode: IEEE 802.3ad Dynamic link aggregation, enpsf4/88:E9:A4:5E:35:35 up, enpsf6/88:E9:A4:5E:E4:15 up
CPU load             15 min load: 93.17, 15 min load per core: 1.46 (64 cores)
CPU utilization      Total CPU: 68.73%
Check_MK Agent       Version: 2.1.0p16, OS: linux, Agent plugins: 0, Local checks: 0
Disk IO SUMMARY      Read: 178 MB/s, Write: 486 MB/s, Latency: 2 milliseconds
Filesystem /         10.92% used (14.58 of 133.51 GB), trend: +962.68 MB / 24 hours
Filesystem /boot     21.6% used (204.46 of 946.73 MB), trend: +5.16 MB / 24 hours
Filesystem /boot/efi 0.38% used (3.62 of 951.12 MB), trend: 0.00 B / 24 hours
Filesystem /flache/metadatadir 0.11% used (32.97 MB of 29.79 GB), trend: 0.00 B / 24 hours
Filesystem /hedvig/d2 10.68% used (32.02 of 299.85 GB), trend: -4.10 GB / 24 hours
Filesystem /hedvig/hpod/data 0.14% used (42.11 MB of 29.79 GB), trend: -519.92 kB / 24 hours
Filesystem /hedvig/hpod/log 0.18% used (54.31 MB of 29.79 GB), trend: -6.19 MB / 24 hours
Filesystem /mnt/d2   0.71% used (430.61 MB of 59.58 GB), trend: +11.66 MB / 24 hours
Filesystem /mnt/d3   20.41% used (164.21 of 804.43 GB), trend: -197.38 MB / 24 hours
Filesystem /mnt/d4   20.68% used (166.32 of 804.43 GB), trend: +927.41 MB / 24 hours
Filesystem /mnt/d5   20.41% used (164.22 of 804.43 GB), trend: -172.10 MB / 24 hours
Filesystem /mnt/f1   0.11% used (34.05 MB of 29.79 GB), trend: -1.94 kB / 24 hours
Filesystem /opt      7.72% used (13.74 of 178.01 GB), trend: +3.68 MB / 24 hours
Filesystem /opt/commvault/MediaAgent64/IndexCache 1.31% used (35.21 GB of 2.62 TB), trend: +189.92 MB / 24 hours
Filesystem /var      39.89% used (8.88 of 22.25 GB), trend: +50.87 MB / 24 hours
Filesystem /var/log  10.07% used (6.72 of 66.75 GB), trend: -501.11 MB / 24 hours
Filesystem /ws/ddb   27.6% used (822.37 GB of 2.91 TB), trend: +8.49 GB / 24 hours
IPMI Sensor Summary  141 sensors - 120 OK - 21 skipped
Interface 02         [bond1], (up), MAC: 88:E9:A4:5E:35:34, Speed: 50 GBit/s, In: 2.95 MB/s (0.05%), Out: 45.5 MB/s (0.73%)
Interface 03         [bond2], (up), MAC: 88:E9:A4:5E:35:35, Speed: 50 GBit/s, In: 292 MB/s (4.67%), Out: 292 MB/s (4.66%)
Interface 04         [bond1.180], (up), MAC: 88:E9:A4:5E:35:34, Speed: 50 GBit/s, In: 2.78 MB/s (0.04%), Out: 43.8 MB/s (0.70%)
Interface 05         [bond1.400], (up), MAC: 88:E9:A4:5E:35:34, Speed: 50 GBit/s, In: 186 B/s (<0.01%), Out: 0.00 B/s (0%)
Interface 08         [enpsf3], (up), MAC: 88:E9:A4:5E:35:34, Speed: 25 GBit/s, In: 614 kB/s (0.02%), Out: 28.4 MB/s (0.91%)
Interface 09         [enpsf4], (up), MAC: 88:E9:A4:5E:35:35, Speed: 25 GBit/s, In: 141 B/s (<0.01%), Out: 8.28 B/s (<0.01%)
Interface 10         [enpsf5], (up), MAC: 88:E9:A4:5E:E4:14, Speed: 25 GBit/s, In: 2.34 MB/s (0.07%), Out: 17.1 MB/s (0.55%)
Interface 11         [enpsf6], (up), MAC: 88:E9:A4:5E:E4:15, Speed: 25 GBit/s, In: 292 MB/s (9.35%), Out: 292 MB/s (9.33%)
Kernel Performance   Process Creations: 17.53/s, Context Switches: 1073606.29/s, Major Page Faults: 4.24/s, Page Swap in: 3.71/s, Page Swap Out: 2.76/s
Log /var/log/messages PEND - Check plugin received no monitoring data
Memory               Total virtual memory: 39.76% - 217.81 GB of 547.85 GB, 10 additional details available
NTP Time             Offset: 0.0323 ms, Stratum: 2, Time since last sync: 13 minutes 14 seconds
Systemd Service Summary Total: 174, Disabled: 21, Failed: 1
TCP Connections      Established: 3053
Uptime               Up since Nov 15 2022 14:12:07, Uptime: 2 days 19 hours
No piggyback files for 'sdes1701-dp.xxxx'. Skip processing.
No piggyback files for '10.24.56.231'. Skip processing.
[cpu_tracking] Stop [7fb78f16fee0 - Snapshot(process=posix.times_result(user=0.04999999999999982, system=0.009999999999999981, children_user=0.0, children_system=0.0, elapsed=0.06000000238418579))]
[agent] Success, Missing monitoring data for plugins: logwatch(!), execution time 1.8 sec | execution_time=1.780 user_time=0.050 system_time=0.020 children_user_time=0.000 children_system_time=0.000 cmk_time_agent=1.710