Hi All,
Please let us know if its possible to capture all syslog events via checkmk.
If yes, please let us know how to setup that.
Hi All,
Please let us know if its possible to capture all syslog events via checkmk.
If yes, please let us know how to setup that.
Hi,
We have setup the event console as per this document but no events are getting triggered.
Hi Team,
We have setup event console as per checkmk doc but checkmk is not able to capture the events even if we have the logs in switch end. Can anyone please help us troubleshoot it. Thanks!
A little bit more information about your doing would be nice.
For instance what rules where created and so on.
You can also enable the debug logging for the event processing to see if your rules are matching or not.
Hi Andreas,
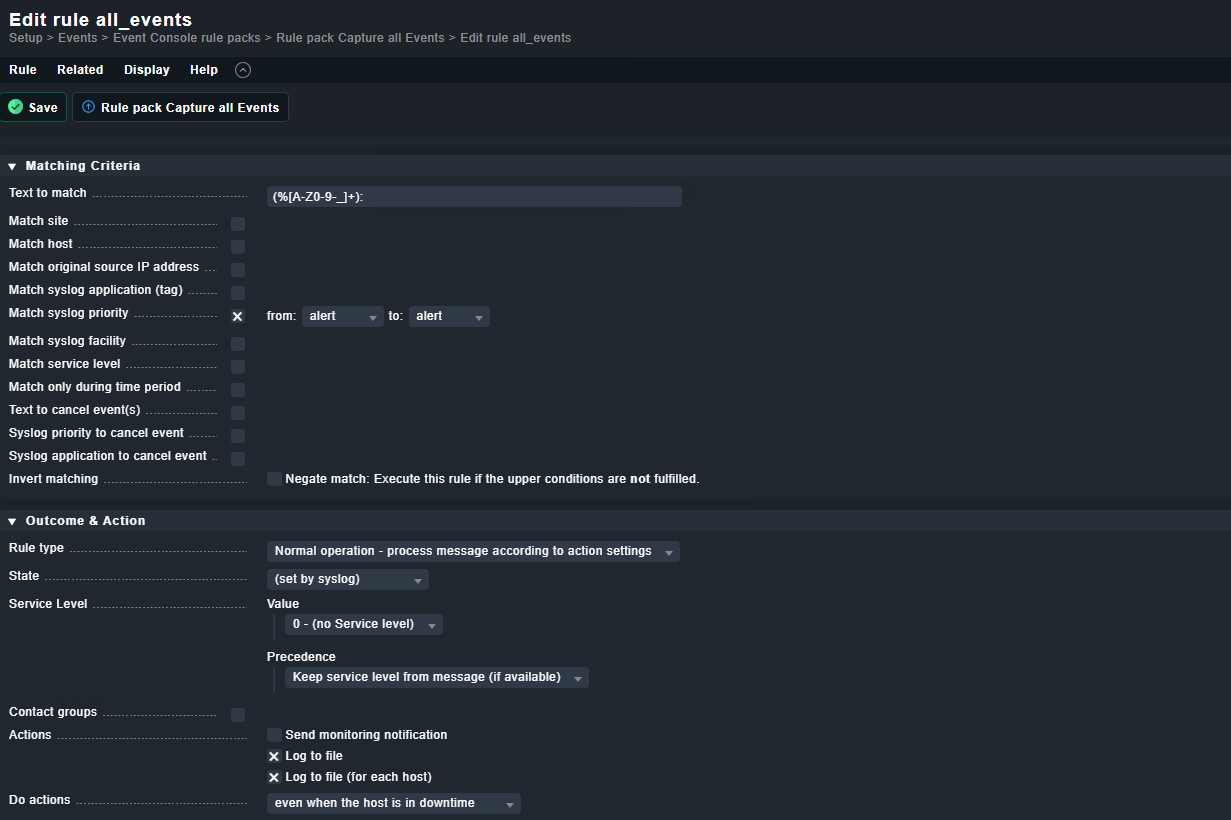
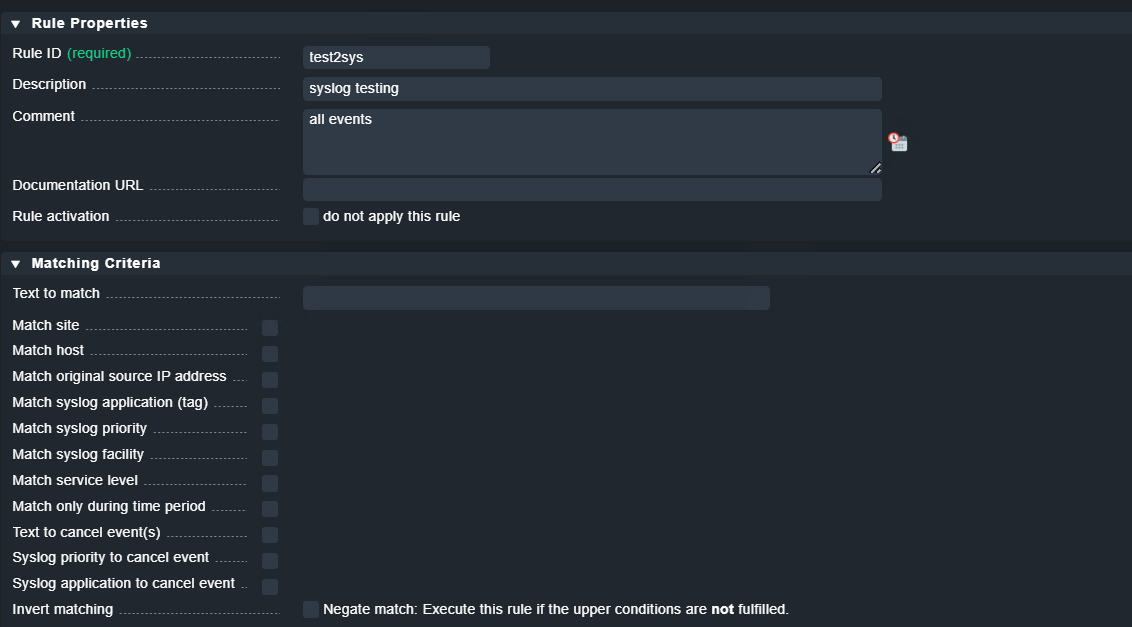
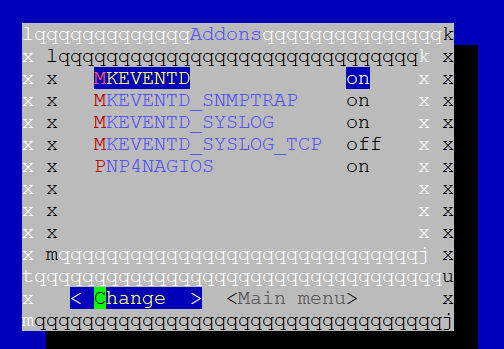
Below is the rule created. As per doc we have enabled the settings via omd config in server.
You are sure that the syslog priority is set to alert at the messages coming?
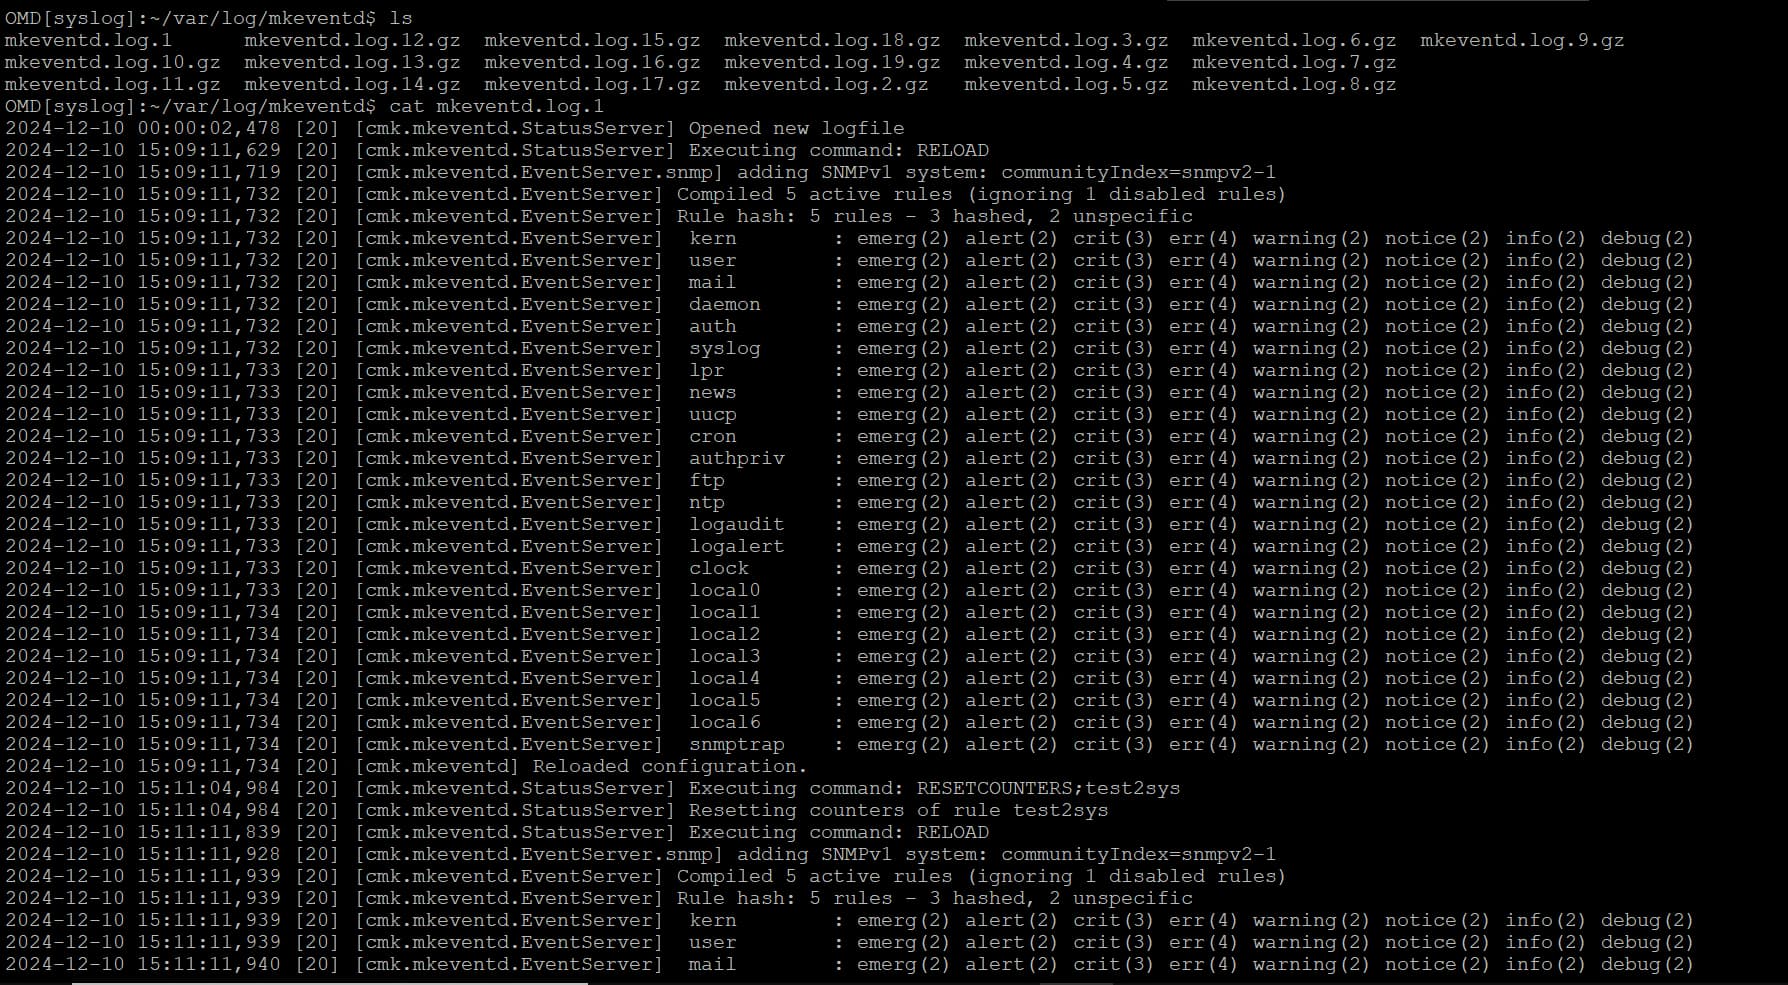
That’s why i said - please inspect the mkeventd logs for what was processed.
Hi Andreas,
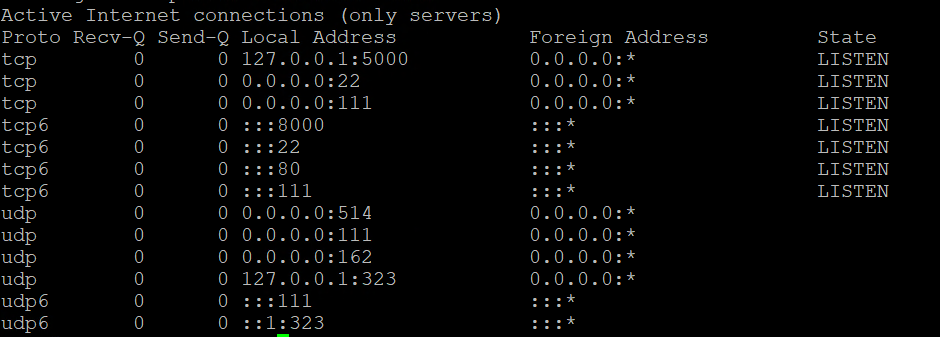
Please let us know if we the ports 514 & 162 in the server end needs to be in Listen State.
UDP ports you will not see as “LISTEN”. The screenshot looks ok.
But please first have a look at the log files of the mkeventd. You can also increase the log level for mkeventd to see all what is happening there.
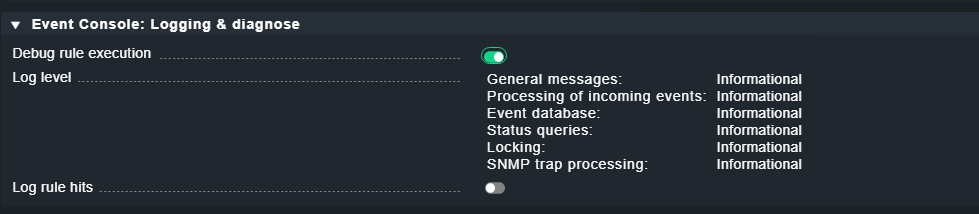
Is this with default log level or with log level set do debug?
This is a default log level and now we have changed it to debug and after checking mkeventd logs we can’t find any.
In your screenshot all the log level is informational. This all should be set to debug. Rule execution debugging will be the next step after you see anything.
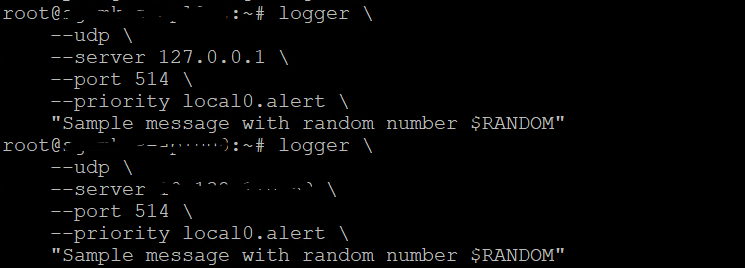
As a first debugging step I’d send a syslog message to the checkmk server manually to make sure that something arrives there:
logger \
    --udp \
    --server 127.0.0.1 \
    --port 514 \
    --priority local0.alert \
    "Sample message with random number $RANDOM"
Change the address to the address of the checkmk server if the command is not run from the checkmk server itself.
If the logger command is not available, then go to a bash shell and issue this instead:
timestamp="$(LC_ALL=C date +"%b %e %T")";
echo "<129>${timestamp} hostname process[1234]: Sample message with random number $RANDOM" > /dev/udp/127.0.0.1/514
Again, change 127.0.0.1 accordingly.
Hi,
We executed the given command and events got triggered in GUI as below.
Please let us know how to further troubleshoot it.
So now you know that alert messages get through.
The rule you have shown earlier catches only messages with priority alert. All other messages are ignored.
As @andreas-doehler already asked: are you sure that your device really sends messages with priority alert?
To my experience these are really, really rare. They usually only happen if the device sending them is just seconds away from going up in flames due to a massive malfunction or whatever.
I would change the rule so that the syslog messages are not filtered out based on their priority. Maybe set that to info…alert or drop that filter completely.
As another test, re-run the logger command with --priority local0.warning instead of --priority local0.alert. With your current configuration that warning message would not make it to the event console, but if you change the rule, it will.
Hi,
We have changed our rule so that events are not filtered based on piriority and tried it already but still no luck
But the logger command still works and the messages appear in the event console?
yes, logger cmd is working
I assume you expect some messages from some device (or computer), lets call that device (A).
So then the following things come to my mind:
Can you run the logger command on that device (A)? You must then change the address (127.0.0.1) to the address of your checkmk server.