Hi!
I use the RAW Edition and have the following scenario:
I use Shelly sensors and a Raspberry PI to monitor various rooms (temperature, humidity, battery).
The metrics are also displayed cleanly.
However, I would like to have the metrics for a room below a service, similar to the “Memory” service. I have rewritten the check accordingly.
root@raspberrypi:/usr/lib/check_mk_agent/local# python3 shelly_environment.py
0 "Serancon: Shelly Büro" temperature=22.7;25;20;0;50 humidity=46.0;60;80;10;100 battery=98;30;10;0;100 Temperature: 22.7°C, Humidity: 46.0%, Battery: 98% (measured at: 2025-01-26 20:39:06)
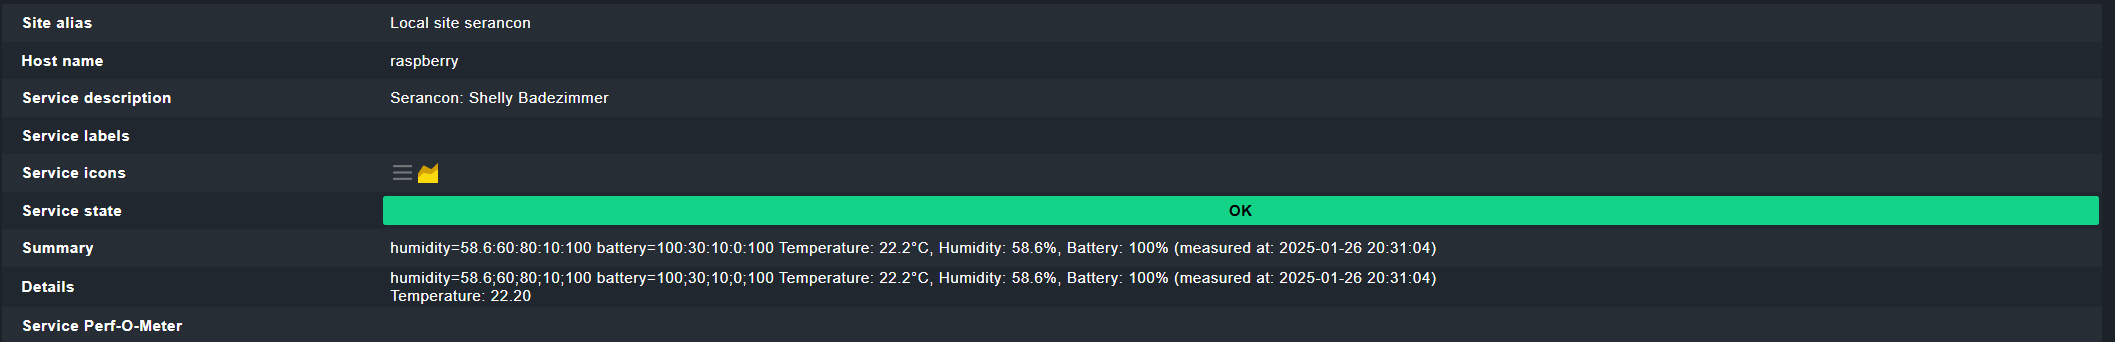
0 "Serancon: Shelly Badezimmer" temperature=22.2;25;20;0;50 humidity=58.6;60;80;10;100 battery=100;30;10;0;100 Temperature: 22.2°C, Humidity: 58.6%, Battery: 100% (measured at: 2025-01-26 20:31:04)
0 "Serancon: Shelly Wohnzimmer" temperature=21.1;25;20;0;50 humidity=48.5;60;80;10;100 battery=100;30;10;0;100 Temperature: 21.1°C, Humidity: 48.5%, Battery: 100% (measured at: 2025-01-26 19:03:01)
0 "Serancon: Shelly Schlafzimmer" temperature=19.7;25;20;0;50 humidity=50.3;60;80;10;100 battery=100;30;10;0;100 Temperature: 19.7°C, Humidity: 50.3%, Battery: 100% (measured at: 2025-01-26 20:24:03)
`
The script returns the following values, which are correct.
The aim is to display the values in individual graphs for each room.
Is this even possible in the RAW Edition? I have already tried a few things, but can’t get any further.
