OrbVis — a NagVis successor candidate (developer preview, feedback welcome)

Checked with some maps and import was working. Also the connection is working with Livestatus TLS now without problem.

Here are my findings/problems :wink:

  • if you import lines that were with an bend/divided in the middle then the import places one point at 0,0 - i know that there are no divided lines available at the moment - manual fixes before import is now - remove the middle coordinate from a 3 coord element
  • elements without explizit z value are placed in the background - inside Nagvis you have a default z value but this value is not inside the map definition - is it possible to place a default z value in the header of the map definition to avoid this all placed in the background?
  • also a z problem is that all lines are placed at the background level and you cannot change this - inside Nagvis lines had also a z value

This are the problems i spotted first at migrating old maps.
Most other things are looking good :slight_smile: :+1:

1 Like

all mentioned problems should be solved with the next release

Thanks for reporting!

3 Likes

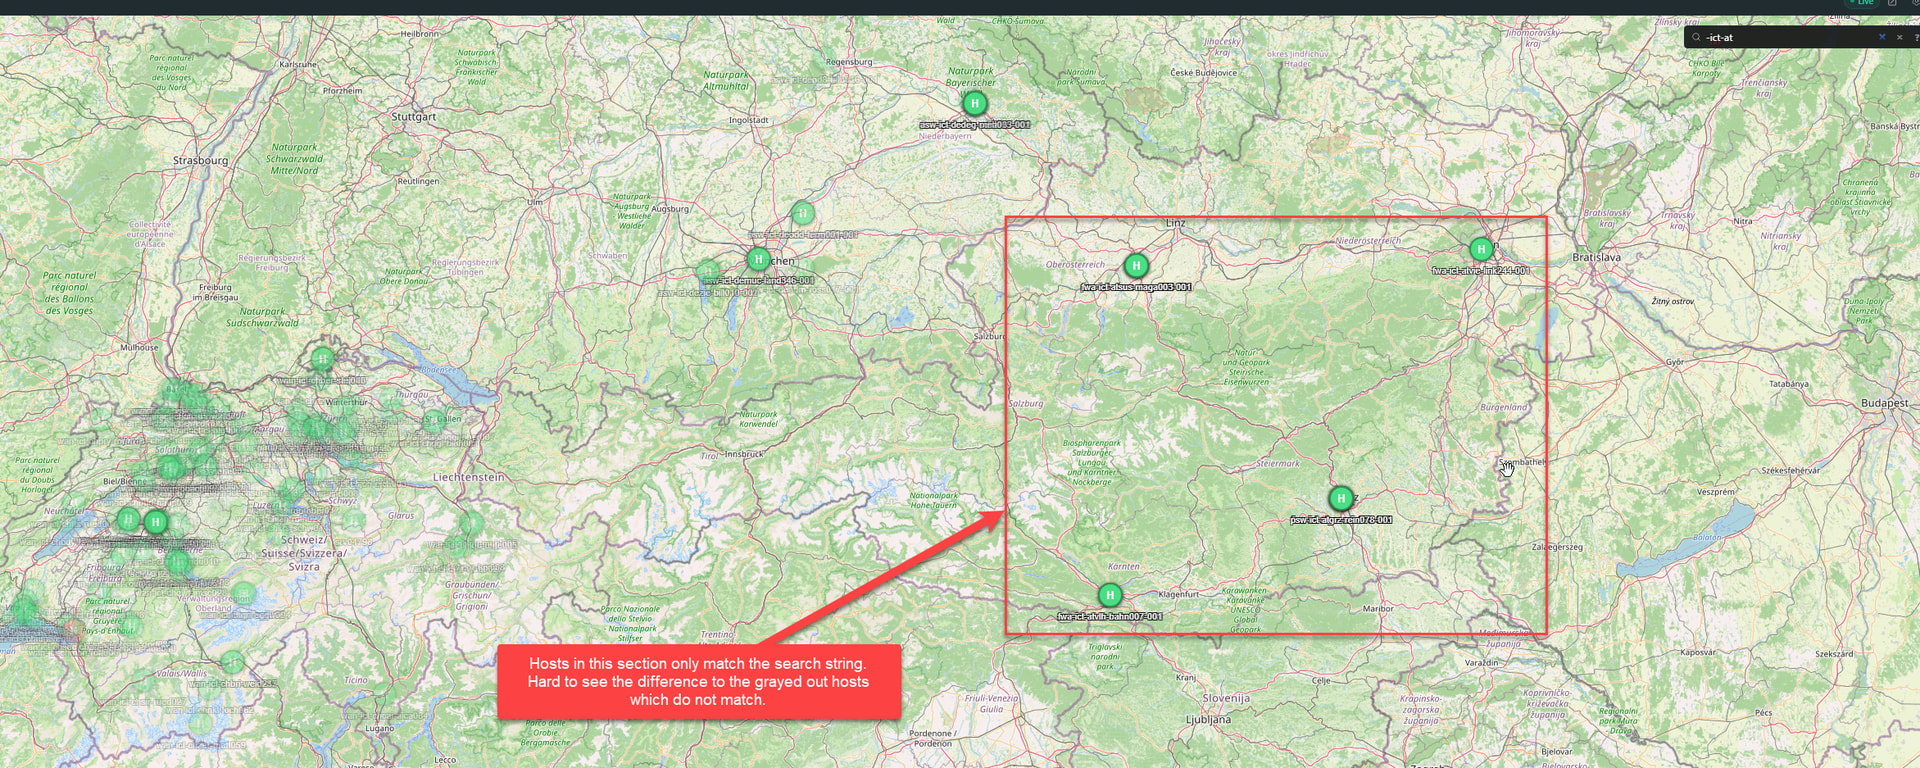
This should already work if you use the search bar. Non-matching hosts are grayed out.

=> If you have many hosts the overview with grey out only is not very heplful.
Expect they matching once are on Top and you can see them. When I search today many hosts are greyed out but the matching once are behind the grey once.

next release contains better dimming and sets matching objects on top

OrbVis 0.5.0 is out

A bigger one this time. 0.5.0 wraps up three weeks of work on the Folder board, finishes the move onto Checkmk’s design system, and — maybe most importantly — adds a release-test pipeline that actually caught several bugs before you could hit them.

What changed?

The Folder board grew up

The experimental SETUP folder-tree board from 0.4.1 got a full iteration based on early feedback:

  • It now opens in the treemap view — the glanceable status surface. Row details moved to hover, bulk acknowledge/downtime to right-click, and the list view stays one click away.
  • Built for big sites: live updates now stream as per-tick SSE deltas instead of full-tree pushes, the list is virtualized and map tiles are pixel-culled.
  • Server-side service search (s: prefix) that scales to millions of services, search auto-expands to reveal matches, and the problems-only filter has a Problem severity threshold — on a typical site almost every host carries some WARNING service, so you can narrow to critical/down only.
  • Per-board site scoping with a site picker for distributed setups.

Distributed monitoring: per-site trust

When a remote site stops responding, its hosts no longer flap to UNKNOWN. They freeze at their last known state, marked as stale, with a visible warning — so a dead replication link doesn’t paint half your board red for the wrong reason.

Lines, icons, visibility

  • NagVis bent lines import faithfully now (explicit middle point), with a Remove bend context action.
  • Per-line z-layering plus a board-wide default_z, matching NagVis semantics on import.
  • Weathermap lines accept a second (outbound) metric.
  • Custom icons are tinted by object status with a solid ring, and the show only problems toggle is available on every board type.

Checkmk look & feel, completed

The frontend now runs fully on Checkmk’s design system: Tailwind is gone in favor of scoped CSS on cmk tokens, the vendored cmk-frontend-vue tree tracks current master, and i18n moved to vue3-gettext following cmk conventions. If you run OrbVis next to Checkmk, it should feel native — including the status color palette, which now also applies to standalone deployments.

Permissions tightened

Host/service actions are gated on granular Checkmk command permissions instead of a blanket admin check, board create/configuration follows orbvis.edit_all/configure, and BI aggregation titles/trees are scoped to the requesting user’s contact visibility.

One thing worth highlighting

This release got a much harder test pipeline: every release now runs a real upgrade test from the previous release tag (old data written by the old version, read by the new one), plus an input sweep that mutates every rendered control on every settings surface. That pipeline caught — and 0.5.0 fixes — among others:

  • omd restart could kill the OrbVis service when a graceful shutdown hung (the old process kept the port, the new one crashed on bind). The init script now escalates properly and caps graceful shutdown.
  • A vendor-refresh regression that silently broke every toggle switch and the settings section navigation.
  • Healthy BI aggregations rendering as PENDING under specific conditions.

Full list in the changelog.

How to update?

Same as before — upload the new MKP via Setup → Extension Packages or on the CLI:

OMD[SITENAME]:~$ orbvis-setup uninstall && mkp disable orbvis && mkp remove orbvis && mkp add /tmp/orbvis-cmk-2.X.mkp && mkp enable orbvis && orbvis-setup

Your boards, backgrounds and settings are kept. (And since 0.3.0, a plain omd restart after mkp enable does the setup step on its own.)

Where can I find it?

As always: feedback, bug reports and ideas are very welcome — here in the thread or on GitHub.

2 Likes

wow - are you sleeping at all :smiley: the release speed is impressive Ronny!
4 Likes

Hi Ronny

thank you very much for your efforts to put Nagvis on its “Altenteil” :slight_smile:
Just upgraded to 0.5.0 and so far it looks good, speed seemed to have increased.
So far i just discovered a phenomenon that just affects Edge/Chrome (and mybe all other Chromium based browsers) but not Firefox:
When creating a new static map, the default zoom level lets the elements flicker very fast and disappears as soon as i zoom in just a little bit. When zooming out to the highest level, the flickering starts to reappear

Best regards and :angry:

Tom

Ok my bad: i forgot orbvis-setup after updating.
Issue seems to have disappeared :slight_smile:

Best
T

1 Like

Overall a really great looking project! Thank you!

A few issues with Nagvis import:

Some service lines import as a mixture of arrow and double arrow middle type

Some have Perfdata label as Percent, some have None

Some have weathermap enabled, some do not; on those that do, the metric (in) is not set, so weathermapping overall does not work without manual configuration.

I can’t figure out a rhyme or reason why the lines are imported differently as they are all the same line types in Nagvis

Right clicking host or service and then clicking Edit properties does not do anything; I have to click on Edit in lower right corner

Wish List:

When importing, allow the ability to override settings to set line style, Perfdata label, icon size, and metric in and out, or have a feature to bulk edit these after import

Allow dragging host labels to a new position independent of their host icons instead of setting Offset X and Y for each

Delay the hover pop up by one or two seconds when moving the mouse over the map or allow configuration of this

Allow zooming the map to less than 100%

Allow custom placement of Perfdata along service lines, preferably by dragging the box.

Allow ability to bulk select and drag objects to a new position

Looks like the line issue is caused by global line defaults and templates which were ignored. Result was falling back to the default…

Regarding weathermap lines OrbVis needs an explicit metric name, nagvis not.
Already on it

Thanks for the input.
At least i already implemented the option to select/drag multiple objects. This will be available in the next release.
I think using the links inside the tooltip of an object is already possible with 0.5.0

@_rb I see OrbVis 0.5.0 is out. Thank you for this release.
I run 0.4.0. do I need to install 0.4.1 and the 0.5.0 or can I go direct to 0.5.0?

Thanks

Mike

you can directly update to 0.5.0

1 Like

Thank you very much for your work so far, this is exactly what i’ve been waiting for.
We’ve installed it on a 2.3 environment and are impressed by its performance, even in a very large environment like ours.

My wish list:

Editing an element should only be possible when I’m in edit mode.
It should be possible to select multiple objects and move them.
A grid should be configurable via “Board Settings.”
It should be possible to snap to the grid.

Thanks a lot for for this project

1 Like

I’m glad to hear that :slight_smile:

Both are already implemented and available with the next release

2 Likes

Maybe am understanding of a Radar Board is wrong, but wouldnt it make sense when the filter is set to hosts to show in the boxes beside the host status also a summary of the service status.
If I look in such a board and all is green I would expect that all is in a good condition but maybe its not because some services are critical and that’s not visible.
Settings the filter to all services shows too many information because one box per service.

Hello,

first of all thank you very much for what you already did!
I really like what’s already been done.

But I have one idea. Would it be possible to add the possibility to display services as text with their states as a color like “rawNumbers.php” does it in NagVis? Or is it already there and I am just missing it?

Here’s an example from NagVis:

grafik

Thank you!

Pascal

1 Like

Version 0.5.0 installed and tested. very happy with it. Great work!
To use it in our daily business we would need following:
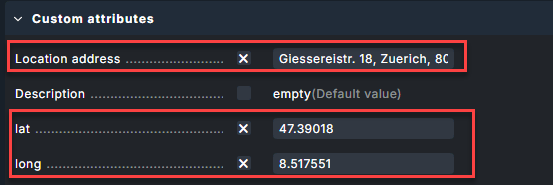
All our Hosts have the long/lat information and an address_location field.

We can not create automatically hostgroups today, as filter on custom attribute in host group assignment is missing.
ccording to this information we would like to have on the MAP a single Icon per Address.
The Address Icon shows the most critical Problem (if no Problems at all - green).
If I click on the address Icon or select expand, it will show me following Options:

  • Flowboard Topology of all Hosts at the address. Root Device can be set by filter on host label.
  • Radarboard
    Ideal multiple boards can be defined with pre-settings.

Idea Address Icon:

Another idea would be to att the filter OnlyProblem with Severity to the board settings.
So we could create per severity boards and rotate it on a big screen.
Board1=>allok
Board2=>allCritical
Board30>AllMinor

Sounds like a good idea to show at least the number of services in state x.
Have to think about this, also related to the performance (but think this could work)

You can also use service groups here but i know what you mean

Currently missing. I will add it

1 Like