Per process CPU monitoring

Hello everyone,

What might be helpful, is to enable the option “Enable per-process details in long-output” in the rules @kdeutsch mentioned.

This way you also get a nice table where you can see a per process CPU and MEM
usage.

Openmindz

Hey @kdeutsch and @openmindz - thanks both for your replies!

I have just enabled Process Discovery and State and count of processes as advised. Since I want to monitor the state of all processes, what should I use in for the ‘Process Name’ for Process Discovery? I have tried using * and this didn’t seem to work, however .* does seem to work (except it doesn’t look pretty!) EDIT: ignore this part, I just realised the ‘Process Name’ doesn’t actually matter since you can choose the option to ‘Match all processes’ for Process Discovery

Once both are enabled, is there a way to view a graph of the CPU usage state for all processes? I have enabled the ‘Enable per-process details in long-output’ for both text and HTML. The HTML doesn’t even render properly (looks like HTML code in the box, not a table or anything) and even using the text option it doesn’t appear to show historic process CPU usage, just the CPU usage at the last time of the agent being polled.

Thanks,

James

Hi @Clemlar,

I don’t believe that’s possible: You will only get a graph for the CPU usage of all processes altogether,
not for each one.

At the risk of contradicting myself a little with the previous tip about enabling the “per-process details”, wouldn’t it be far easier to just log on to the host in question and run “top” or similar? Once you’ve figured out which process it is, you could modify your rules accordingly to monitor the CPU usage of this particular process. This is probably more useful data…

As a side note: For me HTML works either in Firefox or in PaleMoon.

HTH,
Openmindz

Hey @openmindz,

That’s a real shame if we cant graph CPU usage on a per process basis for all processes. It would indeed be easier to log on to the host in question and run ‘top’, except at the point at which a process maxing the CPU, all access becomes unavailable. We can’t even SSH into the instance in question (assuming due to resource starvation). And, being cloud instances, we obviously can’t even gain access to the instance via the console either.

The whole HTML table thing not working is really weird. I’m using CMK Raw 1.6.0p18, Firefox 78.7.1esr and I only see this when viewing the (HTML) table:

Hey @Clemlar

Alright, but does this happen “instantly”? I mean if you monitor e.g. CPU Usage,
and already see it rising (you could set it to a low threshold…), you should have
enough time to log on and check.

Another idea: Install nmon on the host in question, let it
do a data collection in a file. When the host crashes, get the nmon file and
run it through nmon analyzer. There will be a tab in the resulting spreadsheet
with performance data for every single process. Perhaps this helps

EDIT If your not familiar with nmon, that’s fine. A “top” in batch mode
run via cron should work just as well.

Openmindz

Hey @openmindz,

That does help, however we have 400+ instances in question and it seems to happen to around 1% of random instances and at random times (but at least 2 or 3 times throughout the week). We assumed using CheckMK would be the way to go here to be honest, and without ‘bashing’ CheckMK at all (it really is a great product and I’ve been using it for years) it does seem that other products (we would prefer to not use) are able to monitor per process CPU usage out of the box and graph accordingly.

We may well indeed have to script some sort of periodic job that uses nmon or top and dump the statistics to a file on some sort of external storage periodically to get an insight as to what’s going on here (although we were obviously trying to avoid this), but long term it would have been nice to be able to graph the CPU usage of all individual CPU processes anyway.

Thanks for all your help though - very much appreciated! :slight_smile:

James

Good morning @Clemlar

  • The issue with the “HTML display” in your browser is most likely attributed to the fact, that HTML codes are escaped per default, since they are considered “insecure”. You can change this behaviour with a rule per host/service e.g. “Escape HTML codes in service output”.

  • You could also try to use the “Process discovery” rule differently: Try using a sane regular expression instead of “Match all processes” and use “%s” as “Process Name”. The “downside” is that this will result in a new service for every process it discovers that way. In succession, you could create a
    combined graph of all those processes, and you would have all information in a single graph. Now how useful such a graph with e.g. 1000 processes is, is another story…

Note: This approach might be a problem with the number of hosts you’re referring to, in terms of performance and/or licensing (if you use CEE).

Another possibility would be that you write a local check, that e.g. runs top in batch mode, returning the “top ten” processes. With a properly formatted output for the CMK agent you should get the information you need, more easily into CMK.

HTH,
Openmindz

1 Like

Hmm. If there’s a process that’s maxing resources (we assume CPU) and you’re unable to ssh to an affected instance, then the ability to monitor said instance may also be impaired. If an affected system is no longer externally responsive to ssh, then it’s probably likely that you won’t be able to pull much, if any monitoring information from it either.

Also, high CPU isn’t often that fatal in my experience. It’s usually more likely that it’s memory.

So your best bet to start with IMHO is to either learn the dark arts of tuning the kernel oom-killer, or look at a userspace oom-killer daemon like earlyoom or oomd.

If problems persist, then something like monit is usually the answer.

What you then want to look for is some kind of logging that indicates what was killed or restarted and when. Gather that information however you can, collate it and see if you can start to come up with patterns.

Per-process metrics and graphs etc are cool and all, and checkmk could do better there, but I don’t think it’s the best way to diagnose your issue.

Hey @openmindz thanks for your reply! Yep, using “%s” is more the kind of thing I was after all along, but as you say it does mean a new CMK service for every process on each server. I think a combined graph may well not prove useful as you say, although I have seen some graphing tools that do allow you to click/select items on the graph and filter which may have been of help for this. I’m also concerned with the performance aspect, although I’m not sure of how severe the detrimental effect would actually be (yet). It’s very likely I will come back and test this though!

I think your idea of a local check that grabs the top 5 processes and sends them back would be better, although I’m not sure how this would work if one of the processes being graphed then drops out of this top 5? I would assume it would be removed from any graph and we then wouldn’t see it at that point. I’ll take a look at a rule per service to ensure the HTML table is visible…

@rawiriblundell couldn’t agree more with this - I expect that if this is a CPU issue (and further investigation today has pretty much confirmed this) then the ability to monitor (or for the CMK agent to respond in a timely fashion) when CPU is maxed will indeed be impaired.

I haven’t seen monit before, but it does look useful.

I have managed to access an instance today that had 2 of 4 CPU cores maxed out and have pinpointed the process. I’m now working with the 3rd party vendor of the application (Anti Malware - no surprises) to investigate the root cause. While I can’t actually recreate the issue, I’m now able to identify (with a strong likelihood) when and on which instances it is going to occur. Restarting the problematic service resolves the issue instantly.

Thanks to everyone on this thread for all your advice/opinions. Glad to see the community here is thriving and there are plenty of like minded people wiling to help each other out. I’ve also managed to learn a thing or two along the way as well :slight_smile:

James

Anti-malware… not management/client-enforced-McAfee by any chance? :smiley:

I once dealt with client who required McAfee HIPS. It would randomly chew through system resources (it was especially fond of consuming all the swap space), sometimes it would cause kernel panics and it zeroed out random files in /usr/bin (“hey, why isn’t awk working?”). What a steaming pile of turd that software is. Unfortunately I don’t remember the exact details of the underlying problems beyond “ugh, McAfee”, but there was a bit of lsof and strace involved as well as combing through auditd logs.

Good to hear you’ve made progress though, happy hunting :slight_smile:

Hi,
how about a simple local check:

#!/bin/bash

ps ax -o pcpu,command --sort=-pcpu | head -n6 | tail -n5 > /tmp/topproc
i=1
while read CPULOAD LINUXCOMMAND
do
 echo "0 TOP_5_$i cpuload=$CPULOAD $LINUXCOMMAND has a cpu load of $CPULOAD"
 i=$((i+1))
done < /tmp/topproc

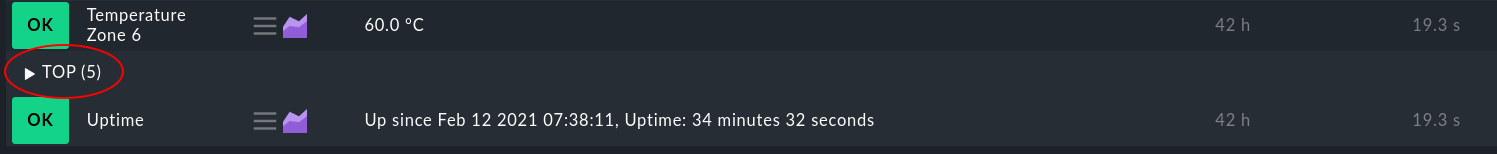
And the result in Checkmk:
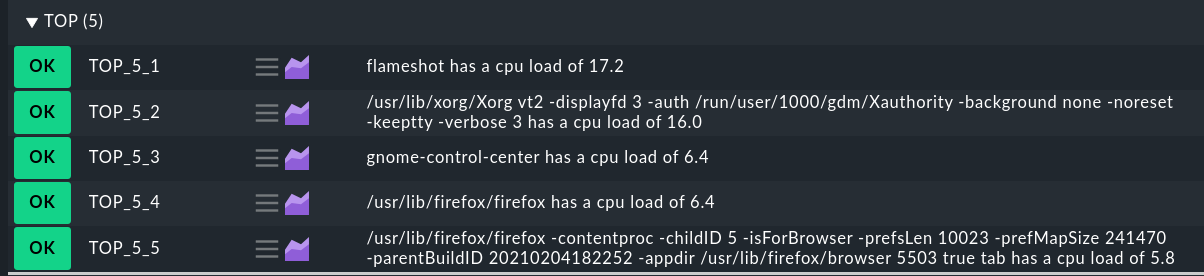
Details:

Karl

3 Likes

Hey @kdeutsch , this is actually the kind of thing I was after (I probably should have just written a local check off the bat). How were you able to aggregate the 5 results for the local check into a group like that?

Is it possible to still view the graph of a process that moves out of the top 5 once it no longer appears in the list?

Thanks,

James

Hi,

you have to setup “Grouping of services in table views” in Global settings.

The graph is shown for the service e.g. “TOP_5_1” - regardless of the process (e.g. Xorg)

Karl

Thanks @kdeutsch - that works really well, and I didn’t even realise you could group like that!

Yep, we always see a graph for each of the Top 5 as expected, but if a process drops out of that Top 5 list and then a day or so later I want to co back and see what a known Top 5 process was using when it was in the Top 5 the day before, is this possible (if it’s no longer in the Top 5 list when I want to view the graph)?

Thanks,

James

Also, for anyone interested that may stumble across this in the future, here is a slightly modified version of what @kdeutsch wrote originally that doesn’t write the check information to disk:

#!/bin/bash

processes=$(ps ax -o pcpu,command --sort=-pcpu | head -n6 | tail -n5)
i=1
while read CPULOAD LINUXCOMMAND
do
 echo "0 Top_5_CPU_No.$i cpuload=$CPULOAD $LINUXCOMMAND has a CPU load of $CPULOAD"
 i=$((i+1))
done <<< "$processes"

EDIT/UPDATE: for anyone looking to do this for processes using memory (instead of CPU):

#!/bin/bash

processes=$(ps ax -o pmem,command --sort=-pmem | head -n6 | tail -n5)
i=1
while read MEMLOAD LINUXCOMMAND
do
 echo "0 Top_5_MEM_No.$i memload=$MEMLOAD $LINUXCOMMAND has a MEM load of $MEMLOAD"
 i=$((i+1))
done <<< "$processes"
1 Like

You should be able to see this in the “Host/Svc” history of the host in question.

Thomas

1 Like

Hi,
and now with threshold values:

#!/bin/bash

WARN=85
CRIT=95

TOPLIST=$(ps ax -o pcpu,command --sort=-pcpu | head -n6 | tail -n5)

I=1
while read CPULOAD LINUXCOMMAND PARAMETERS
do
 echo "P TOP_5_$I cpuload=$CPULOAD;$WARN;$CRIT $LINUXCOMMAND has a cpu load of $CPULOAD"
I=$((I+1))
done <<< $TOPLIST

:slight_smile: Karl

Nicely done @kdeutsch !

I’ve written similar local checks before for things like ‘update status’ for security and non security based updates, also for checking the number of actively connected OpenVPN users etc. In this case I don’t actually require any alerting but this will certainly help anyone else that finds this thread!

I just edited a previous post above to add an example for anyone that may require something similar for memory usage as well.

1 Like
#!/bin/bash

WARN=85
CRIT=95

TOPLIST=$(ps ax -o pcpu,command --sort=-pcpu | head -n6 | tail -n5)

I=1
while read CPULOAD LINUXCOMMAND PARAMETERS
do
 echo "P TOP_5_$I cpuload=$CPULOAD;$WARN;$CRIT $LINUXCOMMAND has a cpu load of $CPULOAD"
I=$((I+1))
done <<< $TOPLIST

This script does not create that useful output. The only relevant information it contains, is: "This process named xyz is currently causing cpu usage abc %.

The command causing the cpu usage may be a different one on every run. So the graphs it generates are completely useless because it consists of values of random programs.

I’m currently too looking for a useful way to do this.

1 Like

This topic was automatically closed 365 days after the last reply. New replies are no longer allowed. Contact an admin if you think this should be re-opened.