Hi,
I can’t understand how to create Metrics from custom Prometheus queries with PromQL.
The rule contains checkbox “Metrics”. But once activated, it asks me to select metrics from an existing (long) list of metrics (which do NOT come from Prometheus).
Also, the “filter by host and service” does not make sense to me.
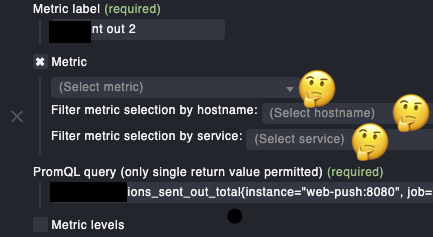
From my understanding, it should be enough to have a checkbox “create metric”, because the metric label is already set with the very first field.
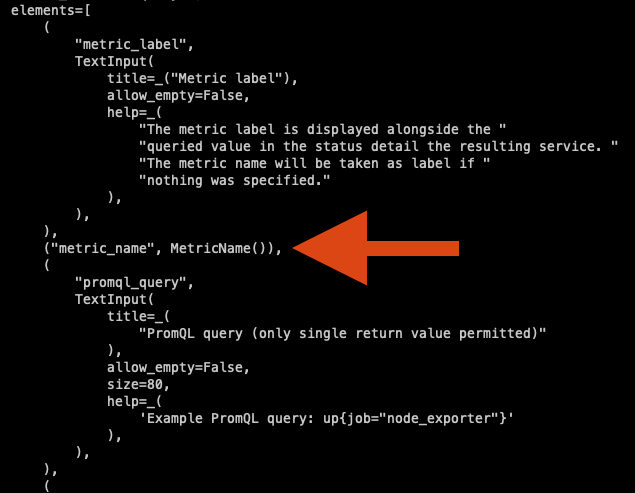
I hope I’m not wrong, but I don’t think this component is correct here. I find it elsewhere when it comes to selecting existing metrics for reports, etc. But this is about creating a metric.
My feeling is further substantiated by the fact that this Metric component does not contain any further help at all, compared to all other components of this WATO page.
The documentation also skips this field completely.
it looks somehow “forgotten”:
Questions here in the forum on how to get metrics from PromQL-Queries are a) rare and b) the few existing ones are unanswered.
Can someone clarify this?
Thanks,
Simon