"Service monitoring rules" vs "Enforced services"

Is there any reason why the same rules are separated in “Service monitoring rules” and “Enforced services”?

If i understood correctly the documentation, the only difference is that with enforced rules the service check will stick to the hots regardless of what can be discovered, so the check is always guaranteed.

If that’s the case, wouldn’t be simpler to have only “Service monitoring rules”, but with an added “Enforced” flag in the rule settings?
That way, when needed any single rule instance could be set\unset as Enforced.

I’m new to checkmk and i really like it, but it seems to be not very intuitive and too overcomplicated.

Or maybe I’m getting older and can’t keep up with anything new anymore :slight_smile:

1 Like

Service monitoring rules add the corresponding service during discovery phase of the host, when these items are found.
The enforced rule adds services statically, without a discovery.

With enforced services you can e.g. expect windows services or processes to be existent or not existent, even when these do not exist on the server.
E.g. you can check if a specific antivirus service is present or you can check the other way round, that teamviewer processes are not running.

1 Like

To my understanding the OP is aware of the difference between these two variants of the rules. But the question is: why do we need these two flavours? Wouldn’t it be sufficient and easier with single rule and a checkbox enforced: yes/no?

  • If unchecked, the rule applies only to the discovered services (on the hosts/service items given in the conditions section).
  • If checked, the rule enforces such a service (on the hosts/service items given in the conditions section).

I must confess I like the question and the idea.

2 Likes

Like the idea as well - Ideas Portal and up vote ? Anyone ?

1 Like

Exactly.


Not sure yet, but the same simplification seems to apply to these:

Enable/disable active checks for services
Enable/disable passive checks for services

Here may be the rule option should have three values:

Apply to all checks
Apply to active checks only
Apply to passive checks only


I asked about another similar possible simplification for check periods here:

Check periods: “for active services” vs for “passive Checkmk services”

I think it is a question for the user interface (:eyes: @theyken) as internally Service Monitoring Rules “only” set check parameters and Enforced Services create a service check. They are evaluated in different parts of the activation process I assume.

@r.sander

I understand that what look similar in the GUI could trigger very different actual configuration changes.

But the configuration GUI is an abstraction layer anyway, so what looks 100% similar to end users could be merged in a single configuration page, with just an added option to define what the rule will apply to.

Maybe I’m wrong, but it looks like all rules below could be simplified.

These:

Service monitoring rules
Enforced services

merged as: Service monitoring rules
new option: -Enforce: Yes|No


These:

Enable/disable active checks for services
Enable/disable passive checks for services

merged as: Enable/disable checks for services
new option: -Apply to checks: All|Active|Passive


These:

Check period for active services
Check period for passive Checkmk services

merged as: Check period for services
new option: -Apply to services: All|Active|Passive

Checkmk’s history is the reason for this. The GUI was not an abstraction but the direct display of how the rules are organized in the configuration files.

Now thanks to the immense effort of the UX team things are getting better. You just opened a new “construction site” for them.

I really hope they’ll make checkmk easier to use.

In the quest to replace PRTG, I explored a few monitoring solutions and with checkmk I’ve had the best end result. And this only using the raw edition and no checkmk agents.

I was about to start playing with checkmk enterprise edition, to understand if we could propose it to out PRTG customers.

But, honestly, all our customers choose PRTG for one reason only: it’s very easy and intuitive.

I’ll admit PRTG is not that powerful or flexible and also our customers have only small to mid-size networks to monitor.

None of our customers want to invest a lot of time or resources in learning and operating a monitoring solution, so in the end they all kept using their existing setup and started paying the very expensive subscriptions.

So far I like checkmk, but I’m afraid it will be a hard sell to customers that want an easy solution.

That’s a bold quote :smiley:
For some of my customers i also provided a little bit support to monitor some new devices with PRTG and the configuration is a PITA.

The GUI is more about what you know or what you like.

That is one of the biggest improvements compared to PRTG. You should test the agents and the easy extensibility.

Then you should show how quick and easy is the daily work with the system.
Onboarding of new devices is in my environments only executing a Bash/Powershell script that does all the agent installation, host object creation and TLS/bakery registration in one single script without any parameters. That means for you customer, new VM → execute script → VM is monitored.

1 Like

I disagree: it’s quick and easy for people with a good knowledge of the program.

Some operations should be easy even for people that won’t work on it daily, so they won’t have a full knowledge of the program’s concepts and inner mechanisms.

You can’t tell me that that’s easy when to operate on a check (to disable or change its time period for example) you have to know the check “type” so that you can look for the proper kind of rule to do it.

Being new to the program maybe I’m still using it the wrong way, but let’s say I want to change the check period for a nagios check service someone else activated on a monitored host in checkmk and that is currently using the default time period.

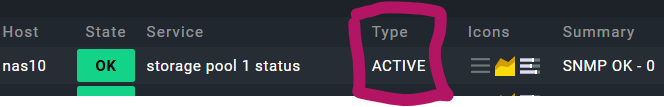
If i click on the service i get this info:

[Service check command]: check-mk-custom!/omd/sites/xxx/lib/nagios/plugins/xxx...

But I can’t find an explicit clue if it’s an active or passive check.

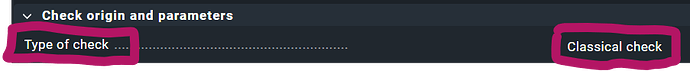
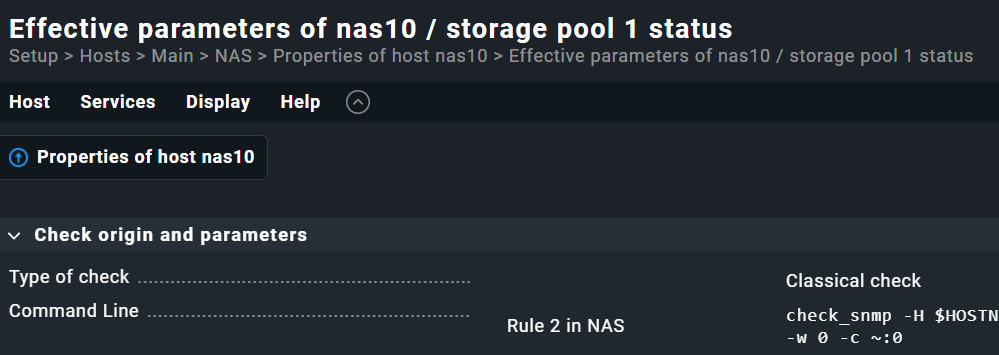
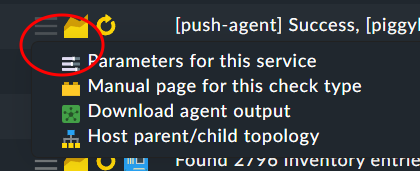
So I click on the “Parameter for this service” icon, I end up on this page:

Properties of host xxx > Effective parameters of xxx / service yyy

and I see:

[Type of check]: Classical check

So still no explicit clue if it’s an active or passive check.

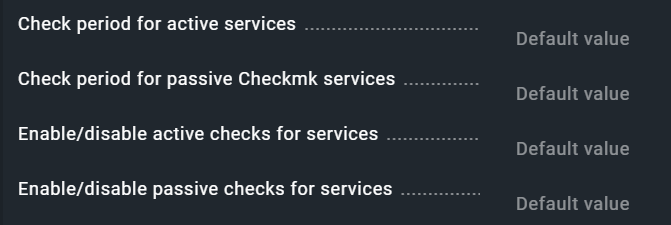
And to make things much worse, on the same page there are links to directly access all rule sets for both active and passive checks, regardless of the actual check type the page was open from.

E.g.

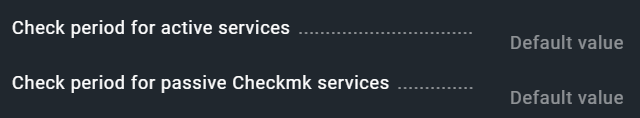
[Check period for active services]: Default value
[Check period for passive Checkmk services]: Default value
[Enable/disable active checks for services]: Default value
[Enable/disable passive checks for services]: Default value


Btw, the simplifications discussed in this topic would solve this issue of having to know if a check is active or passive when working on rules.

Then you have only to click on the “parameters for this service”

There you can assign then parameters you want directly to the service / host / folder.

The easiest way to see if the check is active or passive is this icon.

imagetop one is a active check - bottom is passive check

If you don’t see it, it is inside the “hamburger menu” and can be configured to be visible all the time.

All rules are agnostic to the object they are assigned to. That’s why you see all rules that are effective/possible for this service.

What do you mean by “Rules are agnostic”?

And why do you say that “you see all rules that are effective/possible for this service.”

I see links to both active and passive rules on the “parameters for this service” page:

Since the nagios example I used is an active check, what happens if I by mistake click on [Check period for passive Checkmk services] and configure a period rule in that rule set?

Will the passive check period rule apply to the active nagios check??

You can also say rules are independent of the objects. The whole CMK system is like a big firewall ruleset. You define rules and at runtime(cmk - config generation) these rules are evaluated by every object.

Nothing will happen.

No

And there you have it: the GUI on the “parameters for this service” page is NOT showing only all rules that are effective/possible for this service:

and this makes things complicated for beginners.
The GUI should hide non applicable rules sets or at least clearly state in the same page if the check is active or passive.

Better still, IMHO rule sets shouldn’t be separated at all in active and passive anywhere in the GUI.

If it’s usefull at all, whether a rule will be applied only to active or only to passive check could be an option inside the rule; option that I would default to “all-checks”, so that knowing if a check is active or passive is not required anymore.

At the same time services can be active checks and have different settings if passive check results are submitted. That a check, is an active check, does not mean that it cannot receive passive check results.

Rules where it is not important if it is a passive check or active check are already together in one rule –> “Normal check interval for service checks”. On this rules only the outcome is different for active and passive checks.

As you wrote you are new to the whole environment of Nagios based monitoring systems, the active vs. passive check problem is one of the fundamental things in this ecosystem.

The “Check period” rule is the only rule in the whole system where you have this differentiation. The other “Enable/disable” rules are two really different rules and cannot be one.

Well, if merging active\inactive rule sets is not feasible or it’s too much of an effort, they should at least improve the GUI by hiding links to rule types that won’t apply anyway in the “parameters for this service” page.

Failing that, at least in the “Type of check” field they could write if a check is an active or a passive on.

Right now is like this:

image

but it would be clearer if it were something like Active (Classical check)

While if i enable the service type column in the services view, it clearly shows that it’s an active check.

This would not be so easy as the setup part don’t know if this check is active or passive.
See below there are also “Classic checks” that are passive.

Yes it would be clearer but then you also need to option “Passive (Classical check)” this is also possible.

In your last screenshot, yes there you can see that it is an active check. But this is only known to the monitoring core not the setup, where you create the rules.

As i said before the rules are completely independent from the objects they are assigned to. The setup don’t know if the check is active or passive or any other type at the time of rule creation and assignment.

1 Like

But

“Type of check… classical check”

is visible in a page showing info about the actual service instance:

It really seems strange to me that the active or passive type info is not accessible anymore.

If that’s a page about a specific service instance, thus it can only be an active or passive check and not both (right?), showing links to both active and passive rulesets doesn’t seem to make any sense.

At this point the setup don’t know if your classic check is active or passive. The rule system is not looking inside the running monitoring core to check if a classic check is already existing and what type of check it is there.

No you can have checks that are active checks but also receive passive results.

It is complicated to describe the roots of these active/passive concept as it is far in history of the classic Nagios core :wink:

What you see on the page, with the “Effective parameters” , are all the rules that can match to your service, regardless of whether the rule actually has any effect on the service or not.