Description of the problem:
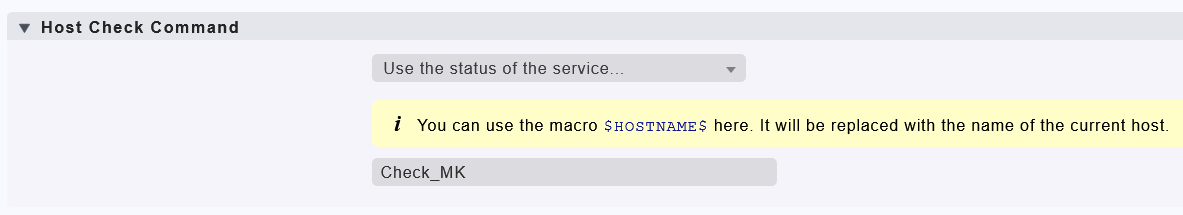
When setting a “Host Check Command” rule (for a host xyz), the service graphs on the page “Service graphs of host xyz” disappear.
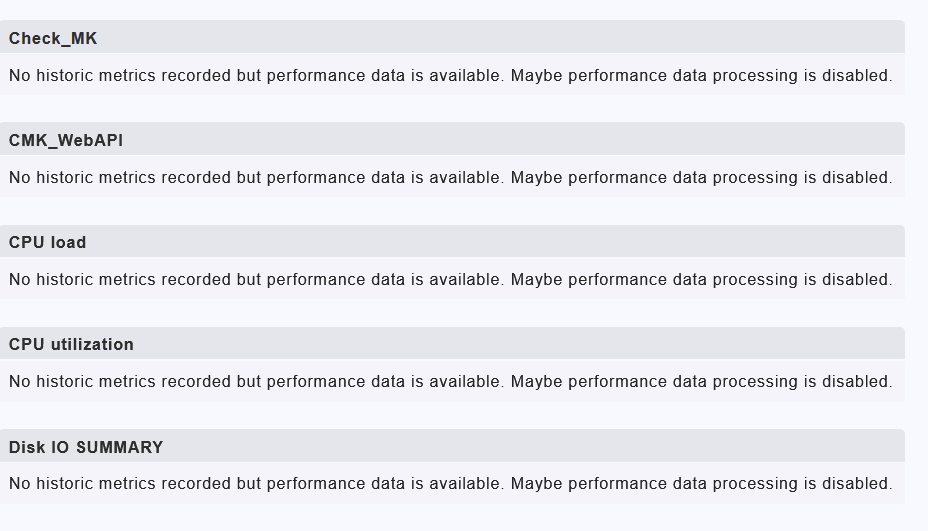
Instead a message “No historic metrics recorded but performance data is available. Maybe performance data processing is disabled.” is shown.
For me, this happens always for the host check command “Use the status of the Checkmk Agent”.
For “Use the status of the service xyz”, it seems to depend on the service chosen as host check.
With “Always assume host to be up” there’s no problem.
The service graphs are fine on all pages. The problem is not with the graphs but this this page.
Steps to reproduce:
Set a rule “Host Check Command” = “Use the status of the Checkmk Agent” for a host.
Wait for the change to be executed
Visit the page “Host” / “Service graphs of host” → The graphs are gone.
The performance data is available, as long as the chosen service in host check command provides perfdata, but it belongs to the service, not the host, so the message is correct…
The performance data is available, as long as the chosen service in host check command provides perfdata, but it belongs to the service, not the host, so the message is correct…
I’m not sure we’re talking about the same thing here. Perhaps for the moment ignore the case with “Use the status of the service…” and let’s have a look at
no host check command
“Use the status of the Checkmk Agent”
“Always assume host to be up”
Regarding the situation you’re facing: what was the former host check command for those hosts?
Quick rationale beforehand: Those hosts are not accessible for Checkmk.
Therefore we implemented our own poor man’s push mode, running check_mk_agent as a cronjob, sftp pushing the output to the Checkmk server. Checkmk picks up the file with a simple datasource program. The datasource program sets an error code -1 or -2 if the file is too old or missing.
(1) no ‘host check command’:
“Service graphs for host …” works, shows the service graphs of the host
But: Host is always DOWN (since the smart pings don’t come through)
(2) host check command = “Use the status of the Checkmk Agent”:
Checkmk’s host status reasonably reflects the status of the host
But: “Service graphs of host …” show error messages instead of the graphs
(3) host check command = “Always assume host to be up”:
“Service graphs for host …” works, shows the service graphs of the host
But: Host is always UP (regardless of the real state)
I’m pretty sure that (2) worked when we were using Raw Edition with Nagios core.
Apologize for the late reply, simply too much work…
That’s something I always tell my team members: “Do read the details of tickets in detail and do not assume something.”
…now I tapped in exactly this trap: I only thought of the host’s perfgraph line (which shows up in the “status of host” page and shows the same message)…
I’ll test again using the “service graphs of host” page tomorrow and report back!
I know, this isn’t the solution for your problem but maybe it is an alternative. We have a similar situation (poor man’s push) and use a custom check plugin as the host check command:
The check check_file_age comes with checkmk and simply checks the age and existance of a given file. In our case it goes yellow if the file is older than 120 seconds and red after three minutes. It is located in ~/lib/nagios/plugins/check_file_age.