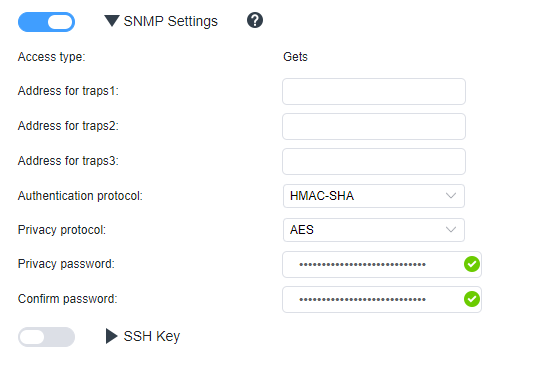
Does somebody know how to configure SNMPv3 on the Xclarity?
I tried everything with any combinations, snmpv3 is on, User is on Read-Only and I tried Supervisor too, there is only one Authentication Protocol, which makes me unsure.
You sometimes need to test the several privacy and encryption protocols Checkmk offers, as vendors often do not clearly state which SHA or AES version they are using.
currently there are no official checks for the Lenovo Servers, but you can still monitor them with the community MKP from @andreas-doehler that you can find here: Checkmk Exchange
As addition to @Norm i would not recommend my old Lenovo XClarity special agent anymore.
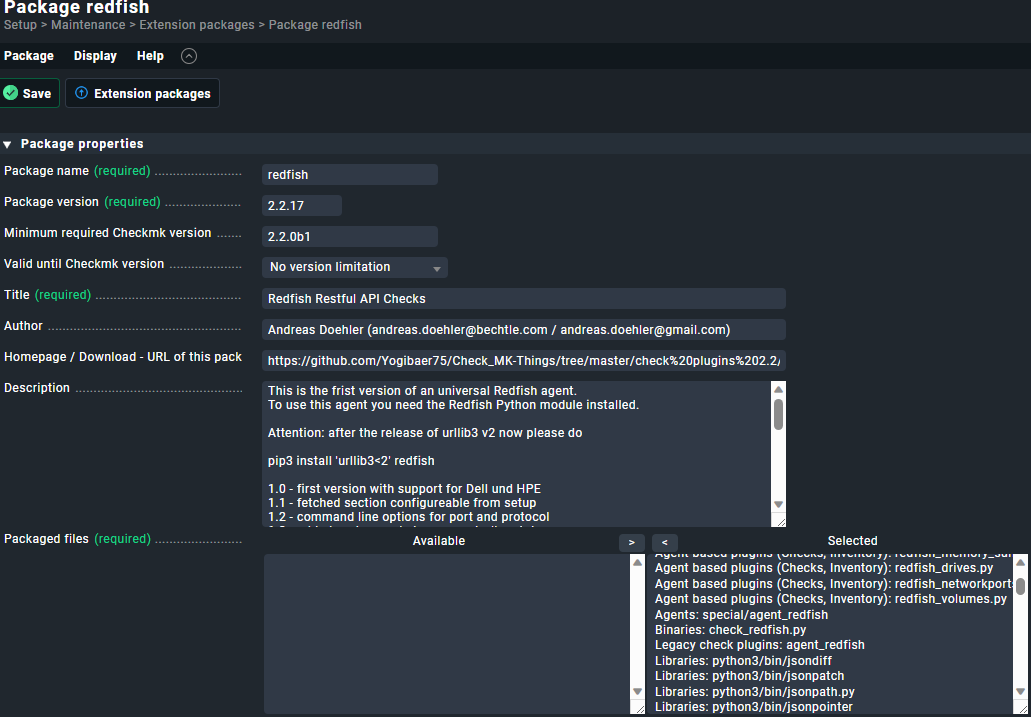
The replacement for this should be the unified Redfish agent here. Redfish Restful API Checks
I’m integrating some of the functionality from the classic check by bb-Ricardo.
It is not finished but has already the checks from the vendor specific checks included.
This plugin is a special agent. First question - do you followed the install instruction in the info and installed also the Redfish Python library?
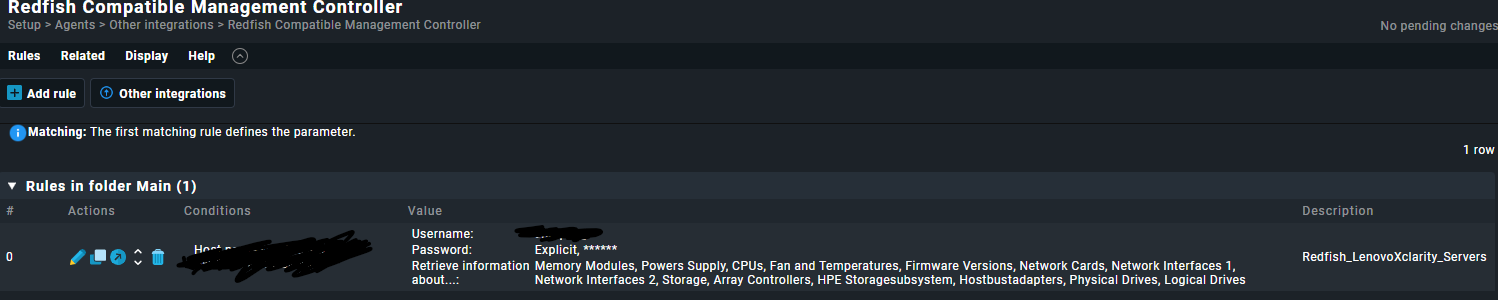
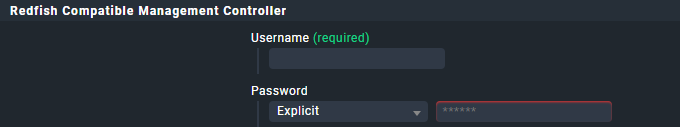
If this is done. You will find under “Setup” → “Other integrations” the entry “Redfish Compatible Management Controller”
Here you can setup the credentials for management interface and what you want to check.
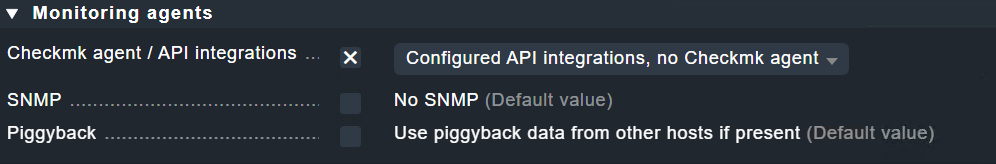
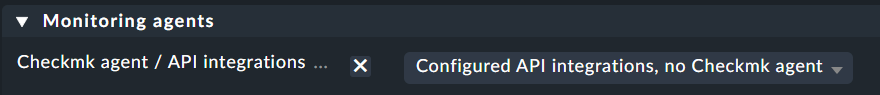
On the host object itself you need to configure it this way.
Instead of SNMP I recommend you to use IPMI.
We use this in hundreds of IBM/Lenovo servers and some DELL severs all with same settings.
From very old one to the latest ones.
I am sorry but at least for Lenovo servers thats not true. We have latest hardware here and monitor still via IPMI.
Currently we monitor ~1400 servers in our local datacenters all over the world. On a Lenovo SR650 I see ~ 163 Sensors in checkmk. If it wouldn’t working my colleagues had been already complaining.
Also we are on the way to implement hardware monitoring via IPMI in our central datacenters to replace the xclarity monitoring. Even here if we would not be able to provide a reliable monitoring my colleagues from central OP wouldn’t accept the solution to replace there current tool.
But yes I agree, IPMI is fairly old standard (SNMP is even much older) and a modern rest api is the current standard in IT industry. @andreas-doehler can you use one plugin to monitor all brands/vendors/models with redfish?
I see that Lenovo has its own Lenovo Redfish REST API.
That is exactly why I made my unified Redfish agent. First i had Redfish agents for every vendor. Now i only work on the unified one.
The only difference between the vendors are, how far they support the Redfish standard definitions. Dell supports already the telemetry specification. This would be a nice addition later.
Supermicro is not so nice but is working
I don’t say that it is not working but missing some important informations.
The IPMI output is normally not including the status of PCIE devices like network cards or raid controllers. Also the status of connected drives is missing.
Temperature, fan and voltage information is the same for IPMI and Redfish.
Thats what we need to avoid the SNMP disaster. I didnt read this in your changelog of the MKP on exchange.
Definately looking forward to this.
For PCIE cards and RAID controllers based on PCIE cards I agree. Lets see how that works with redfish, I am curious. At least on my SR650 I see all drives, the status of the raid cards, the raid log and raid volume status. Basically it always depends on what sensors the vendor implement and provide data for. This limitation remains for redfish.
Here it would be very nice to know how the ipmitool is called to get this information.
I would test this with some older systems where Redfish is not available on my installations.
At the moment i don’t know a way to achieve this.
@andreas-doehler In case we want to discuss technical details about IPMI tool I would recommend that you please open a separate thread because its not related to the TO´s question anymore.
I will share in the new thread all information you may need.
Bei cmk --debug -vvv hostname, erhalte ich nur dass ich keine Informationen erhalte:
OMD[Site]:~$ cmk --debug -vvv hostname
Checkmk version 2.2.0p9
+ FETCHING DATA
  Source: SourceInfo(hostname='hostname', ipaddress='ip-address', ident='piggyback', fetcher_type=<FetcherType.PIGGYBACK: 4>, source_type=<SourceType.HOST: 1>)
[cpu_tracking] Start [7f40c81383d0]
Read from cache: NoCache(hostname, path_template=/dev/null, max_age=MaxAge(checking=0.0, discovery=0.0, inventory=0.0), simulation=False, use_only_cache=False, file_cache_mode=1)
[PiggybackFetcher] Execute data source
No piggyback files for 'hostname'. Skip processing.
No piggyback files for 'ip-address'. Skip processing.
[cpu_tracking] Stop [7f40c81383d0 - Snapshot(process=posix.times_result(user=0.0, system=0.0, children_user=0.0, children_system=0.0, elapsed=0.0))]
+ PARSE FETCHER RESULTS
  HostKey(hostname='hostname', source_type=<SourceType.HOST: 1>)  -> Add sections: []
Received no piggyback data
[cpu_tracking] Start [7f40c8139b10]
value store: synchronizing
Trying to acquire lock on /omd/sites/company/tmp/check_mk/counters/hostname
Got lock on /omd/sites/company/tmp/check_mk/counters/hostname
value store: loading from disk
Releasing lock on /omd/sites/company/tmp/check_mk/counters/hostname
Released lock on /omd/sites/company/tmp/check_mk/counters/hostname
value store: synchronizing
Trying to acquire lock on /omd/sites/company/tmp/check_mk/counters/hostname
Got lock on /omd/sites/company/tmp/check_mk/counters/hostname
value store: already loaded
Releasing lock on /omd/sites/company/tmp/check_mk/counters/hostname
Released lock on /omd/sites/company/tmp/check_mk/counters/hostname
No piggyback files for 'hostname'. Skip processing.
No piggyback files for 'ip-address'. Skip processing.
[cpu_tracking] Stop [7f40c8139b10 - Snapshot(process=posix.times_result(user=0.0, system=0.0, children_user=0.0, children_system=0.0, elapsed=0.0))]
[piggyback] Success (but no data found for this host), execution time 0.0 sec | execution_time=0.000 user_time=0.000 system_time=0.000 children_user_time=0.000 children_system_time=0.000 cmk_time_agent=0.000
Um Sicher zu gehen, das hier der User kommt, wo im Xclarity existiert oder?
Wie könnte ich noch nachchecken ob redfish richtig installiert und konfiguriert worden ist?
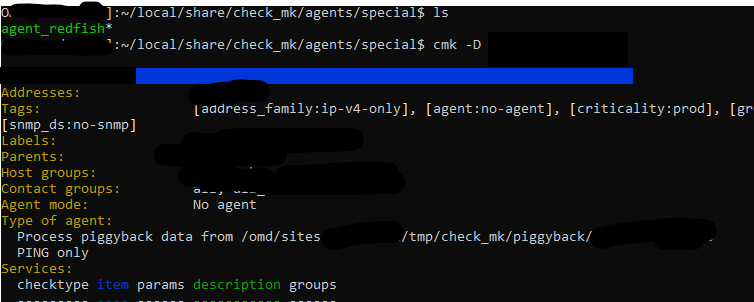
Die Ausgabe sieht so aus wie wenn gar kein Special Agent für diesen Host konfiguriert wurde.
Mittels eines “cmk -D hostname” kann man sich die Config des Hosts anschauen auf der CLI und die Zeile nach “Type of agent:” zeigt normal den Aufruf eines Special Agents an.
Special Agent Zeilen beginnen hier mit “Program: …”
Beispiel Special Agent Proxmox
Type of agent:
  TCP: 192.168.1.2:6556
  Program: /omd/sites/<sitename>/share/check_mk/agents/special/agent_proxmox
Der Host aus dem Beispiel hat auch noch einen normalen Agenten. Die TCP Zeile dürfte bei dir nicht erscheinen.
Dein Special Agent Aufruf sollte ca so aussehen.