Dear Checkmk Community,
Early this month we have let you know about the upcoming release of the first feature pack and asked you to test it first so you can give some early feedback. Thanks to everyone who participated!
Now, it’s finally here! ![]()
As part of our commitment to bring to you new product features and integrations more frequently, we are pleased to announce the official release of the Checkmk Feature Pack 1.
This feature pack includes a new set of plugins. Many of them were some of the most requested plugins at our last Checkmk conference.
It is delivered as a free extension package that is included in today’s product release (1.6p9). If you would like to make use of these features, you can activate them individually.
This feature pack is available to both Checkmk Raw Edition users, as well as to all Checkmk Enterprise users.
So, what’s new in the Checkmk Feature Pack 1?
Here is the list of features that have been included:
- Graylog special agent
- Jenkins special agent and checks
- Jira special agent and checks
- Azure AD: Monitor Users and Sync Interval
- Check plugins for Huawei switches
- Kubernetes ingress and job info
- MongoDB bugfixes and new checks
- TP-LINK Switches Check Plugins
Let’s quickly dive into three of these: Graylog, Jenkins and Jira.
Graylog
Graylog is an open source log management system for collecting, indexing and analyzing data from almost any source. Graylog uses Elasticsearch and MongoDB to store and search log data.
What you can monitor using Checkmk:
- cluster statistics : no. of inputs (all indices), outputs, streams, stream rules, extractors, users
- cluster traffic statistics : input, output, decoded traffic
- failed index operations : total number of failures, no. of failures in a given timeframe, no. of affected indices
- JVM heap size : used heap space, committed heap space
- license state : expired, violated and valid state, traffic limit exceeded, cluster is not covered, nodes exceeded, remote checks failed, traffic limit, time until license expires
- message count : total no. of message (all indices), average rate of messages in a given timeframe (configurable via WATO)
- nodes : load balancer state, lifecycle state, processing state, no. of inputs
- sidecars : sidecar state, sidecar last seen, state of collectors of the sidecar
- sources : total no. of message of a source, avg. message rate for a given timeframe
- streams : total no. of streams, default stream
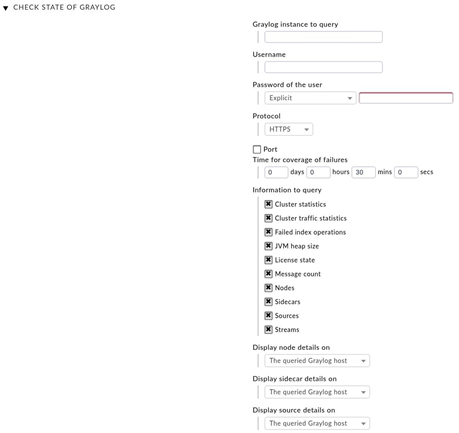
For Graylog nodes, sidecars and sources a piggyback mechanism is configurable via WATO, which allows you to choose if the service is shown on the queried Graylog host or the Graylog node.
To configure it in Checkmk simply use the WATO Rule: Check state of graylog , as seen in the image below.
Jenkins
Jenkins is a Continuous Integration System (CI System) which is used in agile software development. It ensures that small code changes are always immediately tested and implemented in the software.
What you can monitor using Checkmk:
- instance state : quieting down state, if security is used
- job state: display name, state of the job, job score, information about the last build (incl. time since last build, time since last successful build)
- node state: node description, no. of executers (total, busy, idle), if node is an JNLP agent (Java Web Start), idle state, used mode (normal/exclusive), offline state, average node, response time, free temp space
- queue info : queue length, no. of stuck tasks, no. of blocked tasks
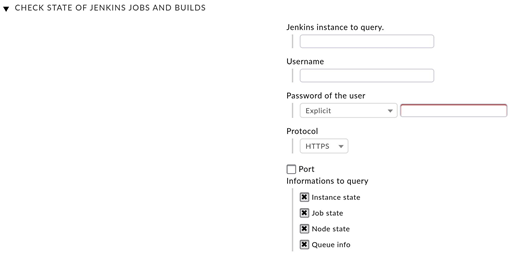
To configure it in Checkmk simply use the WATO Rule: Check state of Jenkins jobs and builds , as seen in the image below.
Jira
JIRA is a tool developed by Atlassian which is used for incident tracking and project management.
What you can monitor using Checkmk:
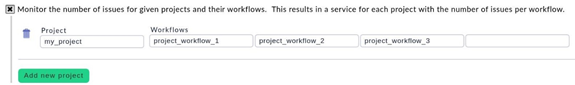
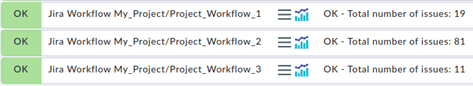
Monitor the number of issues for given projects and their workflows (example: Total number of issues per workflow)
Custom search query
-
result of any given Jira search query (total number)
-
difference to a given timeframe
-
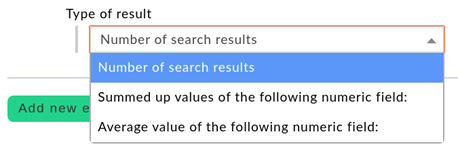
option to sum up or average a given numeric field
-
Example:

-
Option “Sum”

-
Option “Average”

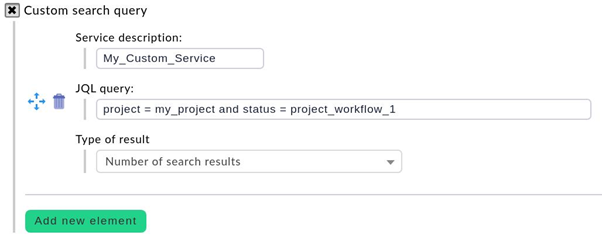
To configure it in Checkmk simply use the WATO Rule: Check statistics of Jira
There are, of course, other great features included in this release and we strongly encourage you to test them out. To use this feature pack you’ll need to install version 1.6.0p9 or newer. For Raw Edition and Free Edition users simply go to our download page and get the latest version of Checkmk.
If you are using the Raw Edition, you can also install these extensions via the command line. For example, you can install the azure_ad package using the following:
OMD[mysite]:~$ mkp install ~/share/check_mk/optional_packages/azure_ad-1.0.mkp
If you are a Checkmk partner or customer, log in using your account’s details to the Checkmk Customer Portal and download the latest version from there.
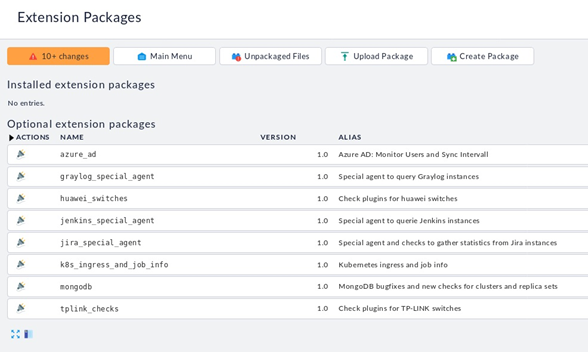
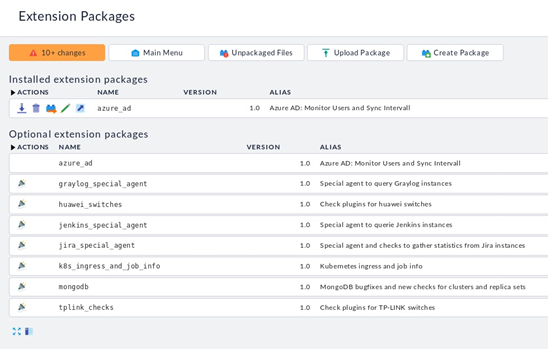
Within Checkmk go to Configuration > Extension Packages and select the package of your choice to be installed. From this point onward it will behave just like any other Extension Package (MKP) that you have installed.
From this point onward it will behave just like any other Extension Package (MKP) that you have installed.
To remove an already installed extension package, click on the trash can icon which you can find under the Actions column, under the Installed extension packages section. You can always re-enable a package at a later point in time using the steps described earlier.
If you’re new to MKPs, please read this article first.
For any questions, please don’t hesitate to start a discussion on this post. Happy monitoring!