Where do you want us to post this Feature request?
@fayepal maybe it’s a good idea to have a category like wishlist or feature request
Just use this Feedback forum. But do not add them to this thread
On the other side, I want to have the service name right next to the state
Why do i want this; If you work with lists of failed services/hosts an reschedule them manually, the rendering of the page becomse veriy fussy, with the simple change of these columns it becomse mutch more stable…
Hi,
I missing the possibility to filter the used rule via wato folders like in 1.6.
We have for example several 100 disabled Services Rules and scrolling through the is a big pain. Now we are searching with the browser builtin text search.
In 1.6 it was possible to filter for the wato folder and then you saw the rules from Main Directory and the regarding wato folder and not all rules.
2 Likes
The intention for our main dashboard is to have something visible for all new installs for the initial user. We are aware, depending on the user’s roles and permissions, the experience might be different. I hope I do not preach to the choir, but this default dashboard can be changed by setting a new start URL via Dashboard > Set as start URL
This works as well “User > Edit profile > Start URL to display in main frame”
These attributes can be set via LDAP variable as explained here: User management with LDAP/Active Directory
We have also started an internal discussion about the right default dashboard (again). If we come to a better solution than today, we will change this
1 Like
Nearly no user knows what he should insert there and the global option works only for new users not for existing ones or users who don’t touched the dashboard link before.
I don’t know any system using this sync from LDAP.
A good start/default dashboard should show a status of the whole systems a user can see but don’t need such parts like the “Events of last 4 hours” as in bigger systems this is normally useless. Some big numbers with problem hosts/services and something like the most recent problems would be good.
The other things what can be changed is again more like discussion about religion ![]()
Should i only see hard states or also the soft state - yes/no. Should i see all service/host problems or only this with notifications enabled - important or nice to know.
You can find so many different things that should be easily configurable, that a dashboard can satisfy the user needs, that it is nearly impossible to find the ultimate solution.
3 Likes
It would be nice to have a dropdown here where one is able to select “Views” or “Dashboards” or “generic URL” and then a dropdown depending on the first choice with all global views or dashboards.
I am always unsure how this data should be stored in LDAP. E.g. the attribute for “disable notifications” should be boolean (true/false). Do we need a custom LDAP attribute for that or is a string attribute enough that stores “true” or “false”.
1 Like
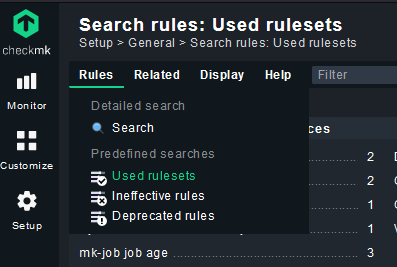
Did you check the option under “Rules”? I think you can find “Used rulessets” there or you talking about something else?
We are still trying to migrate to CheckMK 2.0 fully, but nothing to add. Mostly getting used to the new lay-out and the location of option.
already opened this as a feature request, but I will put it here so maybe someone else finds it useful and votes up 
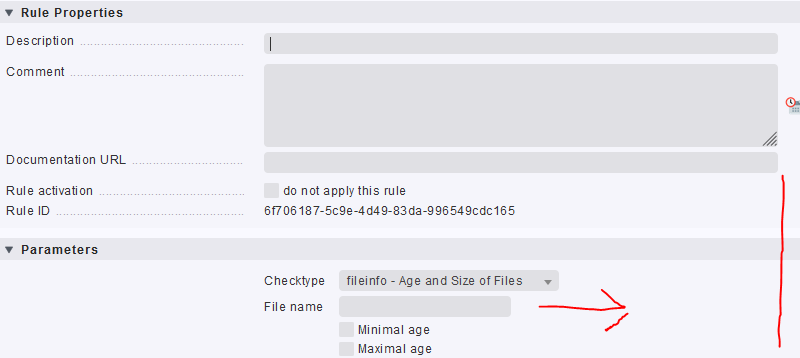
some of the input boxes are very small and are uncomfotable to use, like
- enforced services : Size and age of single files : the box for the file name
- Agent : Count, size and age of files (Linux, Windows) : the boxes for the files to monitor
4 Likes
Service search:
One of the most common attributes I filter for is Service states, which is not in the default options presented. I’m used to that, but using it exposes a rather annoying UI fault.
So, I do a filter on say, System Updates, add the Service States filter, and tick all but OK for Service state, and then bookmark the search.
Some time later, navigate to bookmarks, click on the saved search, the results come up as expected, as does the search filter box, but the search box does not include the Service States filter element.
Expected behaviour: clicking on a bookmarked service search should bring up a search box with all the used filter criteria.
1 Like
If I recall correctly, this is already implemented and should be in p17 (or we have modified another file related input field)
Hi Phil,
From your description, this sounds like a bug. If you are user of the CEE or CME edition, would you mind opening a ticket with this description, so we can fix it and report back. If not, reply here, and I will open an internal ticket
We’re using the 2.0.0p17 CRE edition.
I’d love Service states to appear in the default search filter box too, but I can live without that.
1 Like
I have created an internal issue report from this feedback
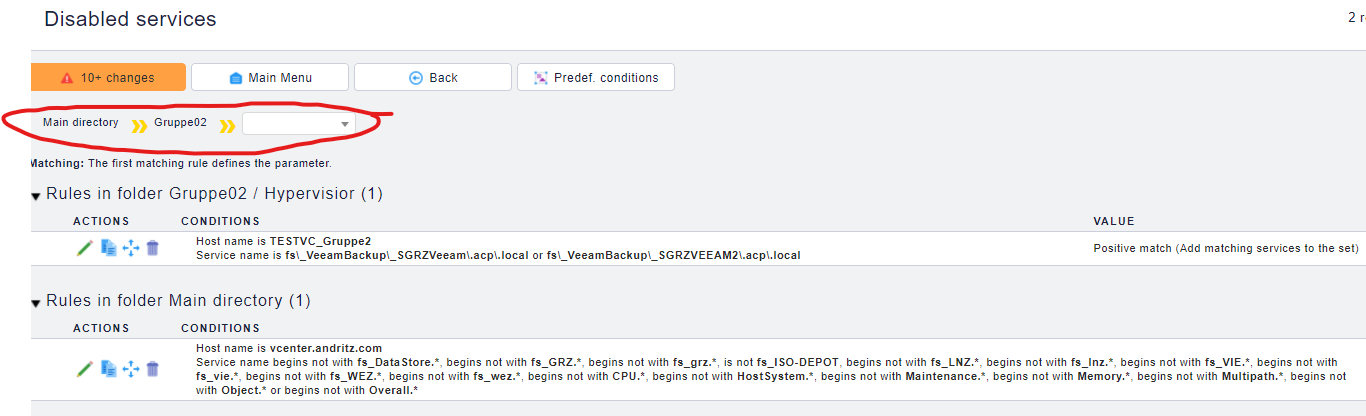
Yes i did check the options under Rules.
No i want the “path” back from 1.6 for the rules.
So that i can navigate through the Wato Folders for one specific Rule.
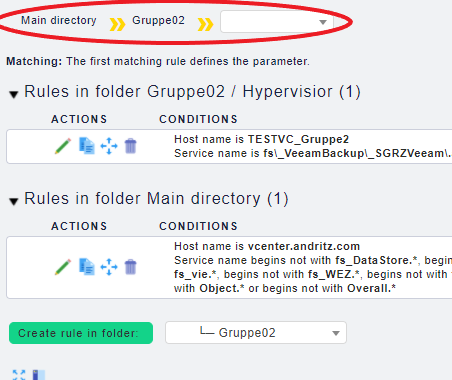
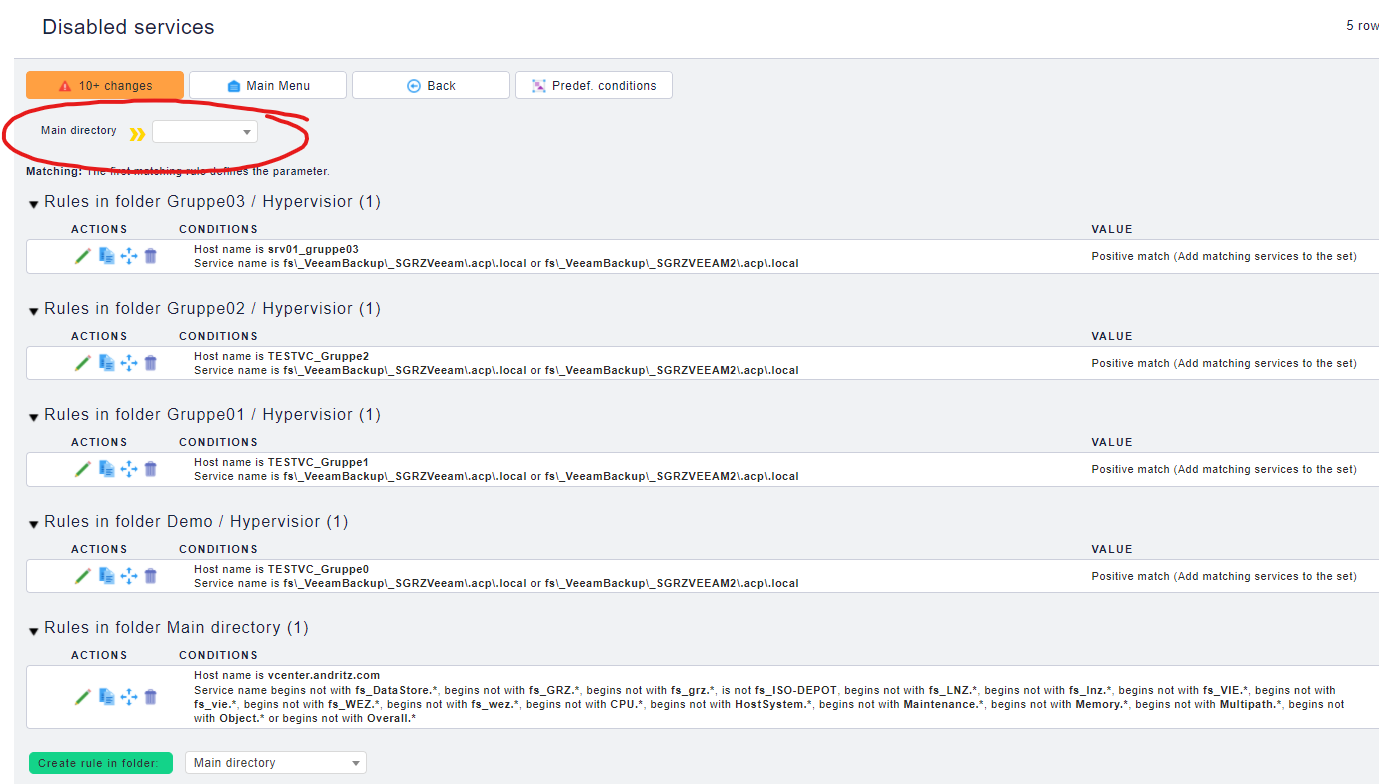
Here you can see the all rules.
And on the second screen you can see the filtered view.
Here you can see the filtered rules which are active from the Main directory and also from the “Gruppe2” wato-folder.
2 Likes
A post was split to a new topic: Hide field name in service details
Maybe change the default layout of the “allhosts” view.
I know of no customer that likes the 3 column view + the listing is a little confusing as well, because the alphabetical order is currently.:
 a -> b -> c
 d -> e -> f
while the optical separation guides the view more vertical:
a   d   g
b   e   h
c   f   i
so my suggestion would be:
simply default to 1 column, because all other major views are in 1 column (that might a little waste of horizontal space, but I think everyone is rather used to that scroll vertically on websites
3 Likes
A post was split to a new topic: Simpler selection of multiple lines using the checkboxes
To me personally it totally makes sense the way it is today. Because the time range only determines to what data set the computation is applied to, but it does not change the computation itself.
It’s like my first-graders math homework:
Add 1 to every number from 1 to 10
or
Add 1 to every number from 10 to 20
to me at least is the same computation, just applied to a different range of numbers
But as you say, I can see why this is dependent on opinion.