Couldn’t agree more.
I always switch back to 1 column as well 
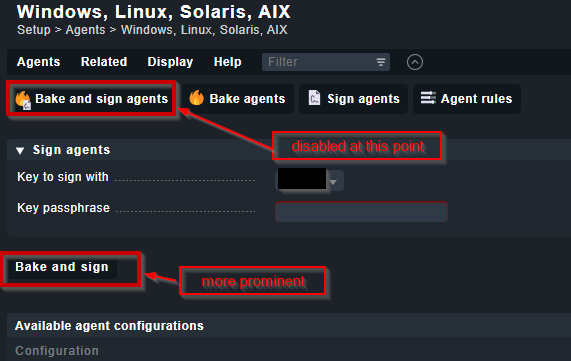
in the agent bakery I always (not alway but very often) click the Bake and sign agents instead of the Back and sign button. this could be improved like this
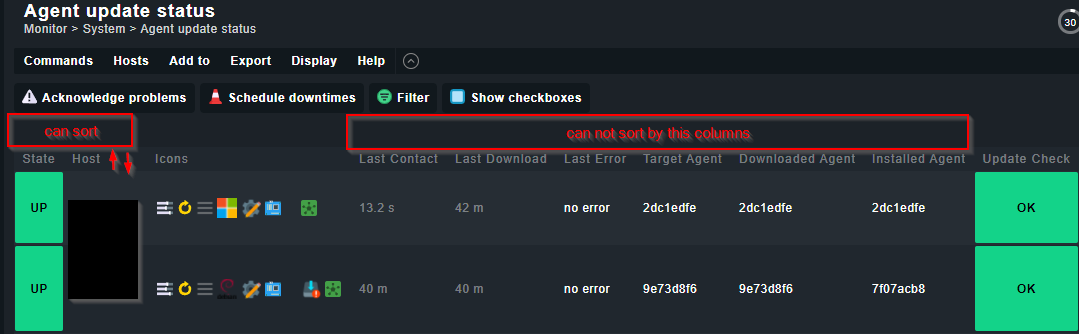
the sorting of tables by just clicking on the column head is inconsistent. For example in the Agent update status you can sort by clicking on State, Host or Update Check but not by clicking on Last Contact or Last Error for example. Would also by nice to have a litle symbol on the column you sorted by (an up/down arrow for example) that shows the actual sort order.
 it would be nice to switch on/off a rule without going to the rule details. Why not have a “switch” before every rule where you can easily enable/disable the rule.
or take it one step further: bulk edit rules  for conditions, deactivation, deletion of rules, would all make sense. But this then become a little bigger feature…
Here’s another UI improvement suggestion: Add csv export to “Setup” and “Customize”, too, not just in “Monitoring”!
(Posting it here, as I regard this as an inconsistency, because the feature exists, but not in all situations, even though it mainly just exports html tables from the current GUI view.)
In normal monitoring views like Service Problems, etc. (most stuff under “Monitoring” in 2.0) there’s a very useful feature: Export → Export as CSV, which makes it easy to export a list of current alerts or other filtered views to Excel or an e-mail.
Unfortunately, in WATO/Setup mode as well as in “Customize”, this menu option does not exist. It could be extremely useful to be able to export the current view in Setup and Customize mode, too. Typical examples might be exporting a list of active rules to document them for an audit or exporting a list of hosts in a specific WATO folder for documentation or for csv bulk-import into another checkmk instance for tests.
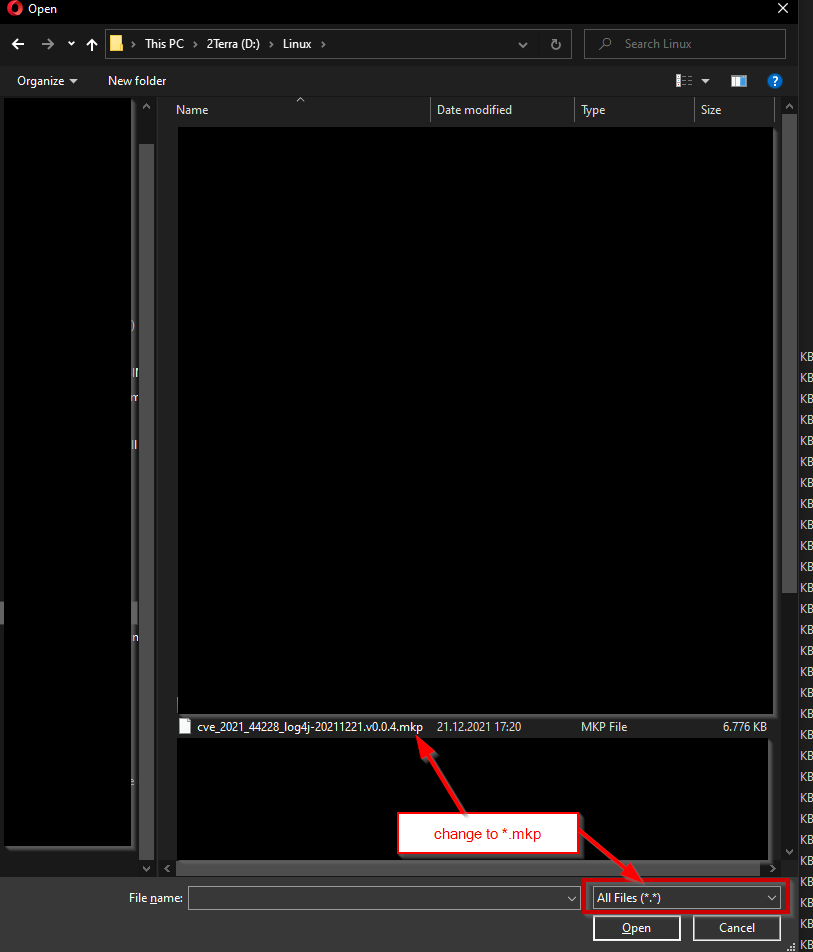
and there are two dozent more places where its like this! Just pain!
I have created a ticket for “enforced services”. “Agent” is already fixed in the Master and will be shipped in 2.1
We review many of our rule configuration pages, but there are many options to look at. So, it is best, if we get good examples of input fields, which need to be enlarged
This is an old post but might be worth including in this list: GUI suggestion: Icons -> Actions
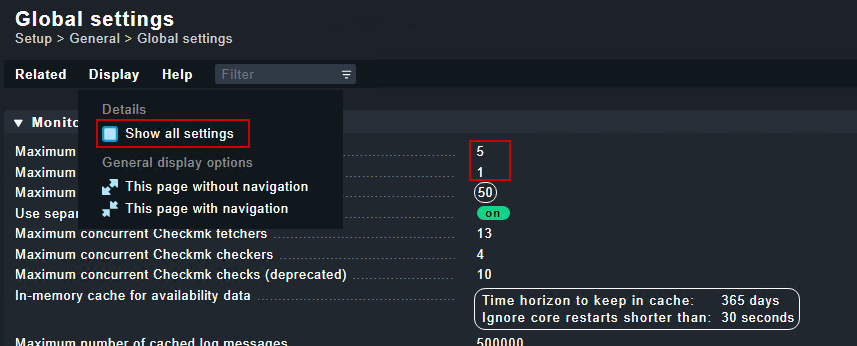
Global settings have an option to filter for only changed settings, that option however is always named “Show all settings” even if all settings are already shown
-
The option should switch names between “Show all settings” and “Show only changed settings”
-
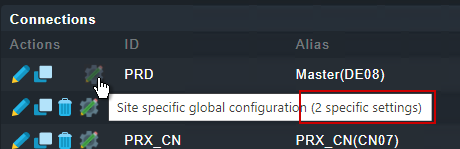
The same option should be available when looking at the site specific settings for a slave. At the moment I can see that a site has specific settings and how many on the mouse-over of the “Distributed Monitoring” view, but I have no way of finding out which 2 settings have been changed. (Unless I dig into the .mk files on the filesystem :))
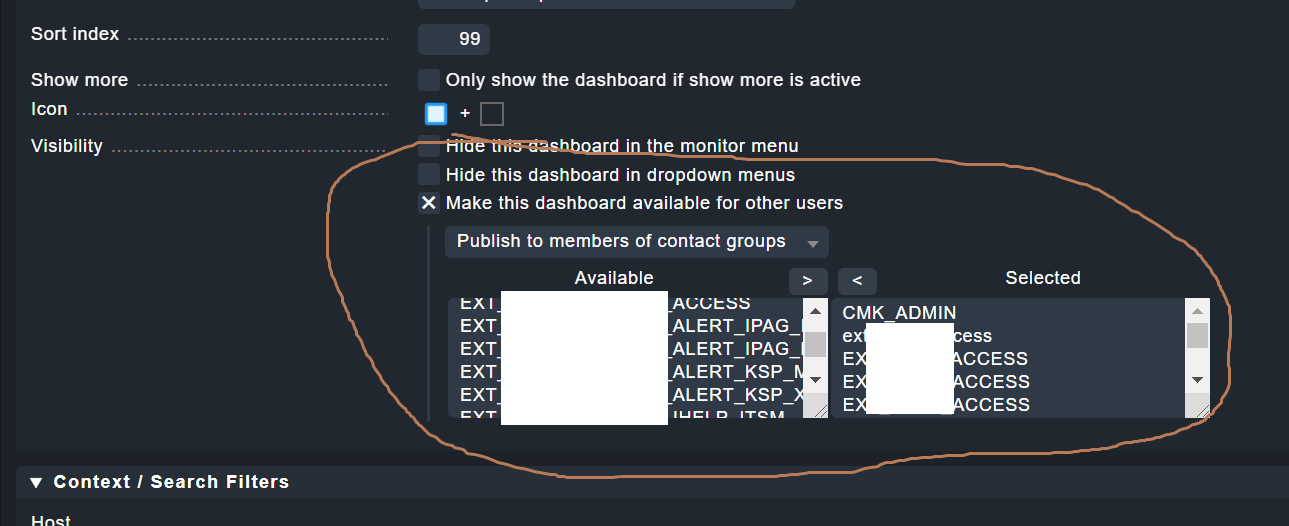
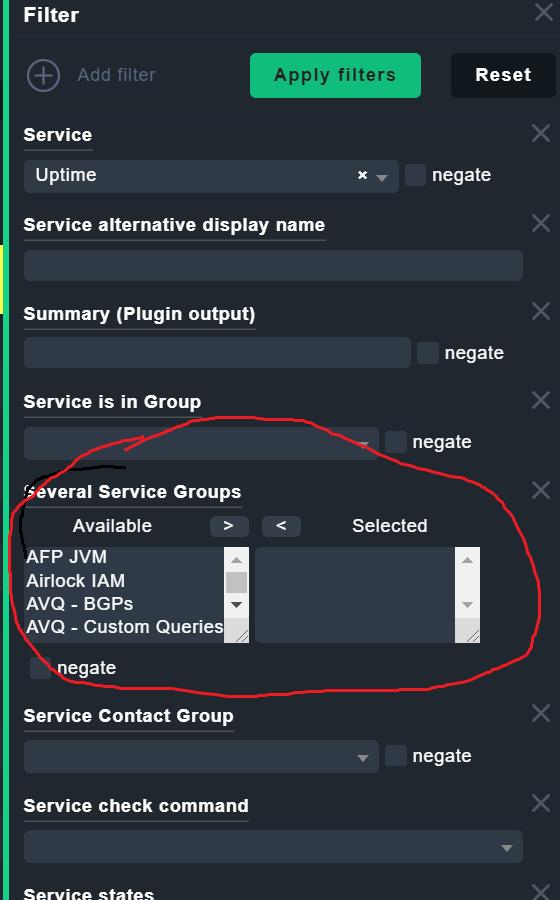
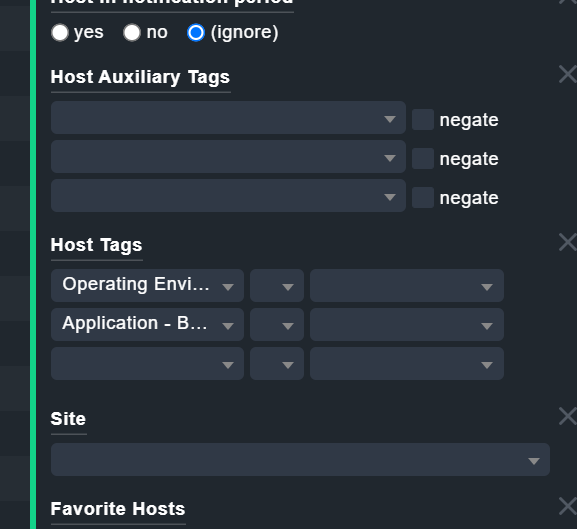
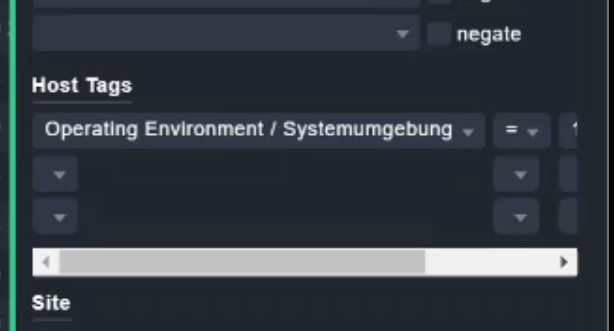
The issue has been fixed:
Checkmk Werk 13388: Tree of folders snapin: Fix default dropdowns
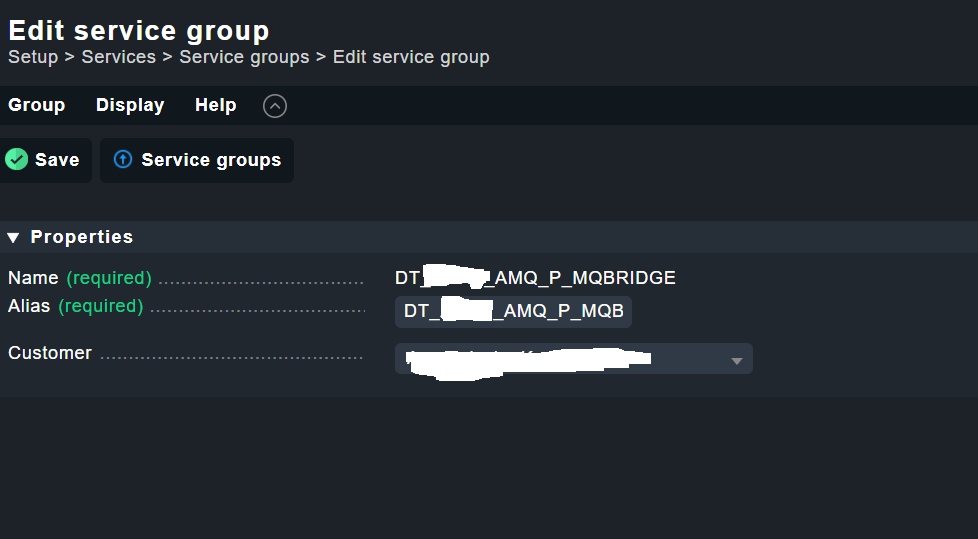

same Problem for Host groups
(its only possible to do 3 posts in a row - slows it quite down with so many short input fields  )
)
In ruleset “Network interfaces and switch ports”, the expression “Port” is misleading and can erroneously be interpreted as “tcp port”. Perhaps use the word “Interface” instead?

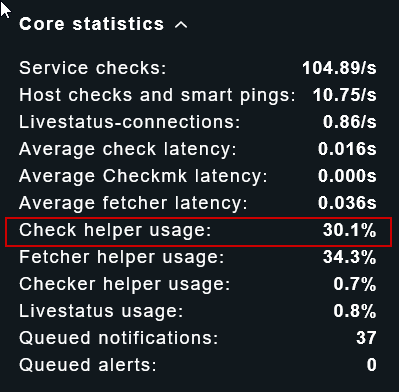
There are at least 3 different names for active check helpers:
-
Core statistics: Check Helper Usage
-
Global Settings -

-
the alert of “OMD Performance” or rather perfdata - “Generic helper usage” (however, in an alert, I think it is “Check Helper Usage” again
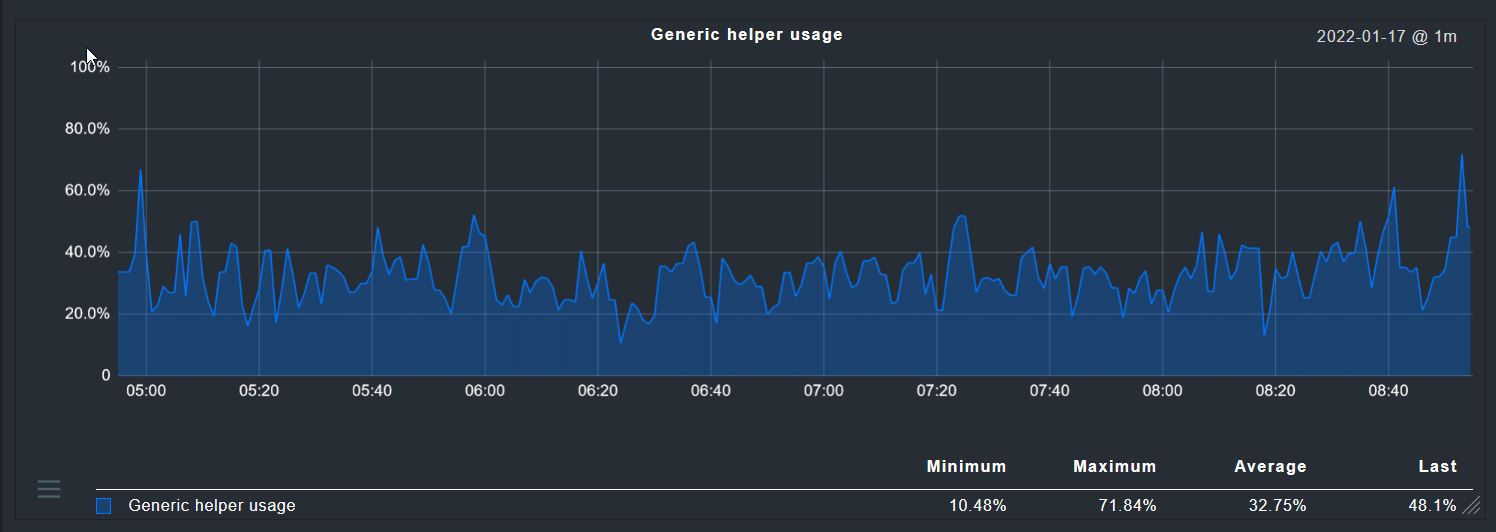
Usually I think it is a bad idea to come up with yet another term, so maybe stick with “generic helper usage”? “Check helper usage” seems like a bad choice, as it is hard to distinguish from “Checkmk helper usage” oder “Checker helper usage” 
(Also